LinkedIn Ads Benchmarks 2026: CPC, CPM, CTR, CVR & CPL
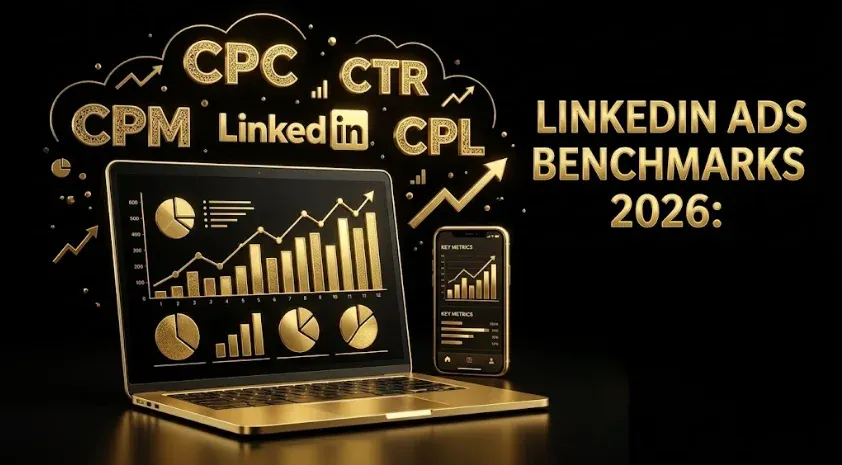
Quick answer: In 2026, LinkedIn Ads benchmarks land in these broad ranges: CPC roughly $5–$9 cross-industry (and $15+ for narrow senior-title targeting), CPM around $30–$60, single-image CTR around 0.4–0.65%, Lead Gen Form conversion rates around 6%+, and CPL commonly $80–$200 — rising to $400–$800 for narrow enterprise ICPs. But blended averages mislead: benchmarks vary enormously by industry, targeting precision, and ad format. The only benchmark that matters is your own trend, compared within a single format and ICP.
Key takeaways
- CPC ~$5–$9 cross-industry; far higher for narrow, senior targeting — LinkedIn is 3–5× Google’s CPC.
- CPL ~$80–$200 typically, $400–$800 for narrow enterprise ICPs.
- Format changes everything. Thought Leader and Document Ads are far more efficient than single-image.
- Don’t use blended benchmarks. Compare within one format and one ICP, or you’ll draw wrong conclusions.
- Judge on cost per SQL, not CPL — a cheap lead that never qualifies isn’t a win.
Benchmarks are useful for sanity-checking and dangerous for target-setting, because a “LinkedIn average” blends wildly different industries, audiences, and formats into a number that describes no real campaign. This guide gives the 2026 ranges worth knowing, explains the methodology behind them, shows how they vary by industry and format, and lays out how to beat them — then how to replace them with the only benchmark that matters, your own pipeline.
How to read these benchmarks (methodology and limitations)
Before the numbers, the honest caveats — because a benchmark you can’t contextualize does more harm than good:
- These are synthesized ranges, not a single dataset. They’re drawn from 2026 LinkedIn Ads benchmark reporting across multiple industry aggregators and CRM-connected datasets, expressed as ranges because published figures disagree — sometimes substantially. Reported CPCs alone span from the mid-single digits to $40+ depending on how narrowly the audience is targeted.
- Definitions differ between sources. “CTR,” “conversion,” and “CPL” aren’t defined identically everywhere; some report Lead Gen Form conversion, others landing-page conversion. Compare like with like.
- Aggregates hide your reality. Your industry, audience seniority, geography, offer, and ad format each move your numbers materially. A cross-industry average is a starting orientation, not a target.
- Recency matters. LinkedIn costs have trended upward year over year, so older benchmarks understate current CPCs and CPMs.
Read what follows as directional orientation, and treat your own account — compared within one format and one ICP over time — as the authoritative benchmark.
What are the average LinkedIn Ads benchmarks for 2026?
Across 2026 industry reporting, LinkedIn Sponsored Content benchmarks cluster in these ranges. Every figure carries wide variance by industry and targeting.
| Metric | 2026 range (directional) | Notes |
|---|---|---|
| CPC | ~$5–$9 cross-industry | $15+ for narrow, senior-title targeting |
| CPM | ~$30–$60 | Higher for narrow enterprise audiences |
| CTR (single-image) | ~0.4–0.65% | Above ~1% is strong; format-dependent |
| CVR (Lead Gen Form) | ~6%+ | Forms convert higher than landing pages |
| CPL | ~$80–$200 typical | $400–$800 for narrow enterprise ICPs |
Two macro trends frame these: LinkedIn CPCs have continued rising year over year (high single digits), and CPLs have climbed as costs rise and form-fill hesitancy grows. LinkedIn remains the most expensive major B2B platform — commonly three to five times Google’s CPC — which is only rational if your ACV and ICP precision justify it.
How do LinkedIn benchmarks vary by industry?
Industry is one of the three big swing factors. While exact figures vary by source, the relative pattern is consistent: regulated, high-value B2B verticals sit at the expensive end because everyone is bidding for the same scarce senior audiences.
| Vertical band | Relative CPC/CPM (directional) |
|---|---|
| Legal, financial services, insurance | Highest — premium audiences, heavy competition |
| B2B SaaS, IT, cybersecurity, consulting | High — dense advertiser competition for senior titles |
| Manufacturing, logistics, healthcare | Mid |
| Education, nonprofit | Lowest |
If you’re in B2B SaaS or IT, expect to sit at the higher end of the cross-industry ranges — and benchmark against your vertical, not the blended average, or you’ll consistently feel like you’re “overpaying” against a number that includes cheap education and nonprofit inventory.
Why are blended LinkedIn benchmarks misleading?
Because a single “average” hides the three variables that actually determine your numbers: industry, targeting precision, and ad format. A blended CTR of 0.5% mixes a broad awareness campaign with an ultra-narrow enterprise one; a blended CPL averages an SMB self-serve offer with a CFO-targeted enterprise play. Comparing your ultra-narrow, Director-plus campaign against a cross-industry average tells you nothing. The fix is to benchmark within one format and one ICP — your enterprise Thought Leader Ads against enterprise Thought Leader Ad norms, not against “LinkedIn.”
Why do benchmarks have to be format-specific?
Because the format gap in 2026 is enormous, and it’s the single biggest reason to distrust blended numbers. Thought Leader Ads and Document Ads consistently and dramatically outperform single-image Sponsored Content — benchmark reporting puts Thought Leader Ads at several times the click-through and far lower cost per click than static image ads, and Document Ads at markedly higher engagement. The person-led and interactive formats (Thought Leader, Document, and Carousel) now account for a majority of Sponsored Content impressions, so a “LinkedIn CTR average” is increasingly an average of two very different populations.
| Format | Relative efficiency (2026, directional) |
|---|---|
| Single-image Sponsored Content | Baseline (lower CTR, higher CPC) |
| Carousel image ads | Higher engagement than single-image |
| Document Ads | Markedly higher engagement (native swipe) |
| Thought Leader Ads | Among the most efficient — far higher CTR, lower CPC |
The practical implication: if you’re benchmarking against blended averages while running only single-image ads, you’re comparing your worst format to a number inflated by better ones. Test Linkedin Thought Leader Ads B2B 2026 and Document Ads before concluding LinkedIn is “too expensive.”
What pushes your numbers above or below benchmark?
If your metrics look worse (or better) than the ranges above, it’s usually one of these levers:
- Audience seniority and narrowness. Tighter, more senior audiences cost more per impression but often qualify better — higher CPM, potentially lower cost per SQL.
- Ad format. Single-image vs. Thought Leader/Document is the biggest controllable swing.
- Creative quality and freshness. Fatigue in small B2B pools inflates cost fast; frequent rotation protects efficiency.
- Offer and funnel stage. A high-friction “book a demo” converts lower than an ungated report; match offer to stage.
- Bidding approach. Autopilot bidding on premium inventory typically underperforms deliberate bidding — see Best 6 Linkedin Ads Agencies For B2B SaaS Companies In 2026.
- Exclusions. Failing to exclude existing customers and irrelevant audiences quietly wastes spend.
What’s a good LinkedIn CPL — and why is it the wrong question?
A “good” CPL depends entirely on your ACV. For a deal worth $10,000+, a $150 CPL that converts to opportunity at a reasonable rate is comfortably profitable; for a $3,000 deal, the same CPL may not work.
Consider the math: a $150 CPL that converts to a customer at a 5% lead-to-customer rate implies a $3,000 customer acquisition cost — comfortable for a $10,000+ ACV, unworkable for a $3,000 one. That’s why CPL in isolation is the wrong benchmark. Evaluate LinkedIn against your unit economics: LinkedIn’s premium is justified when high ACV and a narrow, precise ICP make the pre-qualified audience worth the cost. If your ACV is low or your ICP is broad, cheaper channels usually have better math — the LinkedIn premium only pays off under specific conditions.
Field note: The most common benchmark mistake is optimizing to CPL and declaring victory on a cheap lead. On LinkedIn especially, a $120 CPL at a 20% sales-accepted rate is worse than a $280 CPL at a 60% accepted rate — the “expensive” campaign produces cheaper qualified pipeline. “Cheap LinkedIn leads” almost always means a loose ICP and a low accepted rate. Benchmark cost per SQL, not CPL, or you’ll optimize straight toward the leads your sales team throws away.
How do you beat the benchmarks?
Benchmarks describe the average; beating them is a discipline:
- Use the efficient formats. Linkedin Thought Leader Ads B2B 2026 and Document Ads over single-image.
- Tighten targeting to your ICP. Precision lowers wasted impressions; see account-based LinkedIn targeting.
- Improve conversion before chasing CPC. A better landing experience or Lead Gen Form often beats bidding down — apply landing-page discipline.
- Bid deliberately. Manual and value-aware bidding beat autopilot on premium inventory; see Best 6 Linkedin Ads Agencies For B2B SaaS Companies In 2026.
- Exclude and refresh. Cut existing customers and open opportunities; rotate creative before fatigue inflates costs.
- Measure to pipeline. Tie spend to CRM outcomes so you optimize on qualified pipeline, not surface metrics.
How do you benchmark against your own pipeline, not just the platform?
The most valuable benchmark is internal: your cost per SQL and pipeline-per-dollar over time, by format and ICP. Platform metrics (CPC, CTR, CPL) are inputs; the output is pipeline. Connecting LinkedIn and CRM data turns “what’s our cost per SQL by campaign and format this quarter versus last?” into a direct question — via the LinkedIn Ads MCP and the complete MCP stack — and pairs with lead scoring to define what “qualified” means. Because much LinkedIn influence is dark-funnel (engaged-but-no-click), add self-reported attribution to catch what platform metrics miss. For the paid-search equivalent of this exercise, pair this with your Google Ads benchmarks analysis.
Frequently Asked Questions
Q1. What is a good CPC on LinkedIn Ads in 2026?
Cross-industry CPCs cluster around $5–$9, but narrow, senior-title targeting commonly runs $15 or higher. LinkedIn CPCs are typically three to five times Google’s. “Good” depends on format and ICP — Thought Leader Ads run far cheaper per click than single-image ads.
Q2. What is the average LinkedIn Ads CPL in 2026?
Typical B2B CPL ranges roughly $80–$200, rising to $400–$800 for narrow enterprise ICPs targeting senior titles at large companies. CPL should always be read against ACV and sales-accepted rate — a cheap lead that never qualifies isn’t a win.
Q3. What is a good CTR on LinkedIn Ads?
For single-image Sponsored Content, roughly 0.4–0.65% is typical and above ~1% is strong. But CTR is highly format-dependent: Thought Leader and Document Ads routinely see multiples of single-image CTR, so always compare within a format.
Q4. What is the average LinkedIn CPM in 2026?
LinkedIn CPMs cluster roughly $30–$60, rising for narrow enterprise audiences where senior-title targeting compresses available impression supply. CPM is driven mainly by how narrow and senior your audience is.
Q5. Why are LinkedIn Ads so expensive compared to Google?
Because you’re paying for precise access to senior professionals in a limited inventory, so CPCs run three to five times Google’s. The premium is justified only when high ACV and a narrow ICP make the pre-qualified audience worth the cost.
Q6. Do LinkedIn Ads benchmarks vary by industry?
Yes, substantially. Regulated, high-value verticals like legal and financial services sit at the expensive end, B2B SaaS and IT are high, and education and nonprofit are lowest. Benchmark against your own vertical rather than the blended cross-industry average.
Q7. Should I use blended LinkedIn benchmarks to set targets?
No. Blended averages mix industries, targeting precision, and formats into a number that describes no real campaign. Benchmark within a single format and ICP, and judge success on cost per SQL and pipeline rather than platform CPL.
Q8. Is LinkedIn Ads worth it given the high costs?
It’s worth it when your ACV is high (often cited around $15,000+ LTV) and your ICP is narrow enough that precise targeting pays off, because pre-qualified leads reduce downstream sales effort. Below those thresholds, cheaper channels usually have better unit economics.
Sources & further reading
- 2026 LinkedIn Ads benchmark reports from industry aggregators and CRM-connected datasets — treat figures as directional ranges; they vary widely by source, industry, and targeting, and definitions differ.
- LinkedIn Campaign Manager documentation — metric definitions and ad format options.
- Benchmark against your own cost-per-SQL and pipeline data by format and ICP, not blended platform averages.
This guide compiles directional ranges from multiple 2026 sources for orientation only; figures disagree across reports, costs trend upward over time, and your results depend on your industry, audience, format, and offer. Validate against your own account data before setting targets.
Related guides: B2B SaaS Linkedin Ads Frequency Cap Benchmarks 2026 Impressions Per Member Sweet Spot Fatigue Thresholds · B2B SaaS Ad Testing Framework Google Ads Linkedin Ads 2026 · LinkedIn Ads MCP · Landing Page Optimization for B2B SaaS · Multi-Touch Attribution for B2B SaaS.