Stop Wasting Ad Dollars on Junk Leads — Fix It with QLA
Read More
Google Ads MCP

Your Marketing Analyst Who
Never Sleeps

Get insights, brainstorm ideas, and create the plan for the next quarter in minutes with your personal AI marketing analyst.

$120M
in Ad Spend Analyzed
200+
Accounts Optimized
27%
Avg. Savings Identified
BG Square Polygon Hero V4 - Saasfy X Webflow Template
✨Meta Ads MCP — Free Access

Turn GA4 Data into Actionable Insights

With our Agentic AI, instantly analyze traffic patterns, conversion funnels, and user behavior — get answers to complex analytics questions in plain English.

Setup Now for Free!
Please enter a valid work email
Please select at least one option.
Thank you! Your submission has been received!
Oops! Something went wrong while submitting the form.
$120M
in Ad Spend Analyzed
300+
Accounts Optimized
27%
Avg. Savings Identified
Sound Familiar?

These are the problems keeping analytics teams up at night

GA4 is Confusing
New interface, new data model, new everything. Finding simple answers takes forever and nothing works like UA did.
Can't Answer Simple Questions
"Where did our traffic come from last month?" turns into 30 minutes of clicking through reports and exporting data.
Conversion Tracking Chaos
Events, conversions, key events — what's actually being tracked? Your funnel has gaps and you can't figure out where.
Attribution Black Hole
Which channels are actually driving conversions? Data-driven attribution sounds great but you can't make sense of it.
Stakeholders Want Answers NOW
Executives ask questions, you scramble to build custom reports. By the time you have answers, they've moved on.
Data Sampling Nightmares
Your reports show "(sampled)" and suddenly your numbers are unreliable. High-traffic sites suffer the most.
How It Works
From Zero to Insights in 5 Minutes

No complex setup. No learning curve. Just connect and start optimizing.

1

Connect Your Ad Accounts

Login to the platform, securely connect your Google Ads, Facebook, LinkedIn, or HubSpot accounts with one click. Your unique access token is generated instantly.

2

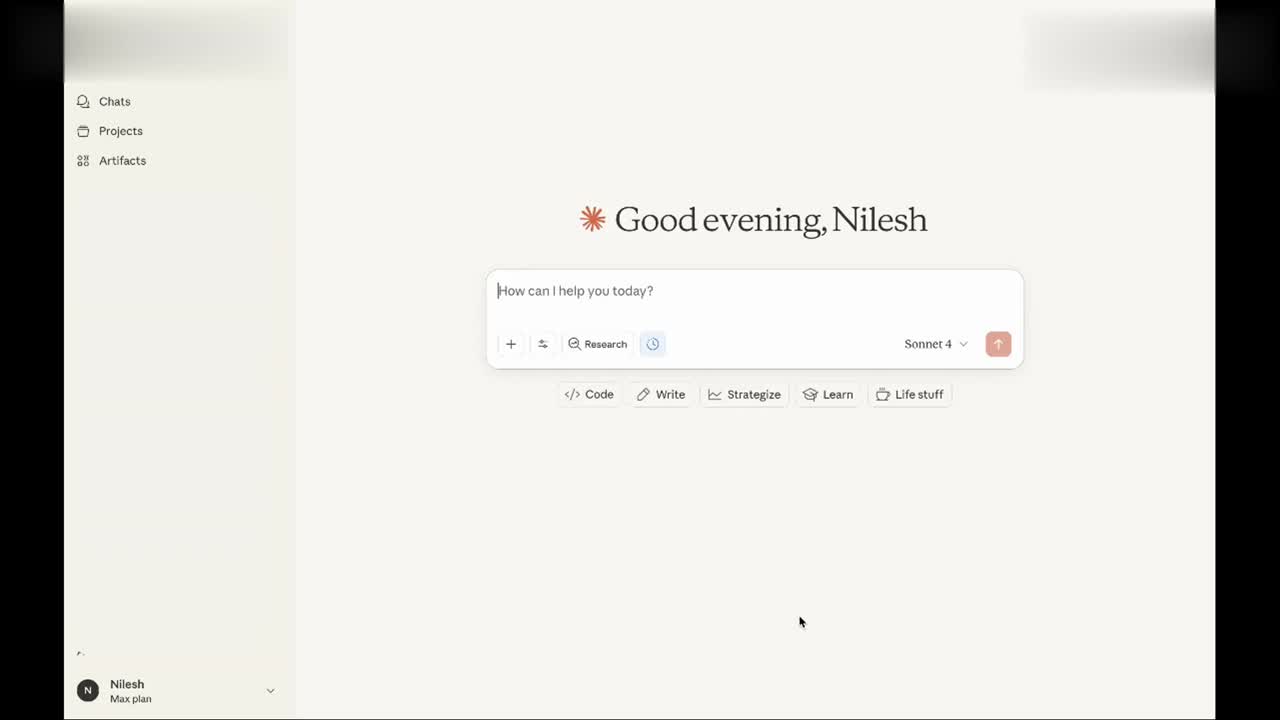
Set Up Your AI Assistant

Download Claude Desktop, drag and drop the extension file, and you have a powerful AI analyst ready to work — no coding, no configuration.

3

Ask Anything, Get Answers Instantly

Paste your token, and start asking: "Where am I wasting money?" "Why did CPA spike?" "Show me underperforming keywords." — Get actionable insights in seconds.

Turn GA4 Complexity Into Clear Answers

Traffic Source Analysis
🔊

📊 TRAFFIC OVERVIEW (Last 30 Days)

I've analyzed 47 active creatives across your campaigns. Here's what I found:

Total Sessions:

47,832 (+12% vs. previous period)

TOP TRAFFIC SOURCES

Source/Medium
Sessions
Conv. Rate

google / organic

18,421

3.2%

google / cpc

12,845

4.8%

direct / (none)

8,234

2.1%

linkedin / paid

4,521

5.2%

KEY INSIGHT

LinkedIn paid traffic has the highest conversion rate (5.2%) despite lower volume. Consider increasing budget allocation here.

Reply to Claude...

Research

Sonnet 4.5

Conversion Funnel Analysis
🔊

🔄 FUNNEL PERFORMANCE

I've analyzed your signup funnel from the last 30 days. Here's where users are dropping off:

FUNNEL STEPS:

  1. Homepage Visit → 47,832 users (100%)
  2. Pricing Page → 12,456 users (26%) — 74% drop-off
  3. Start Trial → 3,241 users (6.8%) — 74% drop-off
  4. Complete Signup → 1,847 users (3.9%) — 43% drop-off

🚨 BIGGEST LEAK

Homepage → Pricing has a 74% drop-off rate. Users aren't finding the pricing page or aren't compelled to explore further. Consider adding clearer CTAs above the fold.

RECOMMENDED ACTIONS

  1. Add "View Pricing" CTA to homepage hero section
  2. Test social proof elements on pricing page

Reply to Claude...

Research

Sonnet 4.5

User Behavior Analysis
🔊

📈 ENGAGEMENT METRICS

  • Avg. Session Duration: 2m 34s
  • Pages per Session: 3.2
  • Bounce Rate: 42%
  • Engaged Sessions: 58%

TOP PAGES BY ENGAGEMENT

  1. /blog/complete-guide - 4m 12s avg. time, 12% conversion
  2. /features - 3m 45s avg. time, 8% conversion
  3. /case-studies - 3m 21s avg. time, 15% conversion

HIGH EXIT PAGES

  1. /pricing - 68% exit rate (potential friction)
  2. /contact - 3m 45s avg. time, 8% conversion

KEY INSIGHT

Case studies have your highest conversion rate (15%). Consider featuring them more prominently and creating more customer success content.

Reply to Claude...

Research

Sonnet 4.5

Attribution Analysis
🔊

🎯 CONVERSION ATTRIBUTION

Here's how your channels contribute to conversions using data-driven attribution:

Channel Contribution to Conversions:

Channel
Conversions
Assist Rate

Organic Search

342

32%

Paid Search

287

18%

Organic Social

156

45%

Email

134

52%

KEY INSIGHT

Email has a 52% assist rate — it rarely gets last-click credit but plays a crucial role in nurturing conversions. Don't undervalue this channel based on last-click alone.

Reply to Claude...

Research

Sonnet 4.5

Traffic Spike Analysis 📊
🔊

Your question: "What drove our traffic spike last Tuesday?"

🔍 ANALYSIS

Tuesday Traffic vs. Average:

+247% (8,432 vs. 2,430 avg.)

ROOT CAUSES (Ranked by Impact)

  1. Hacker News Feature (72%) - Your blog post "Why We Switched to..." hit #3 on HN, driving 6,100 sessions
  2. Twitter Viral Thread (18%) - CEO's thread got 1.2k retweets, driving 1,520 sessions
  3. Newsletter Send (10%) - Tuesday newsletter drove 812 sessions

CONVERSION IMPACT

Despite 247% traffic increase, conversion rate dropped from 3.2% to 1.1%. HN traffic has high bounce (78%) and low intent. Focus on capturing emails for remarketing.

Reply to Claude...

Research

Sonnet 4.5

Unlock the True Potential of Your Marketing Efforts
Answers in Seconds, Not Hours
Stop clicking through reports. Ask questions in plain English and get instant answers with context and recommendations.
Find Hidden Revenue Leaks
Discover funnel drop-offs, high-exit pages, and conversion blockers you didn't know existed.
Finally Understand GA4
No more confusion. Get clear explanations of your data, what it means, and what actions to take.

Why Us?

Nothing better than hearing the answer from other fellow Marketing Leaders, right?

Arnav Mahajan
Chief of Staff, Fleetpanda

This tool has saved us hours each week. The real-time recommendations are spot-on, and we’ve plugged budget leaks we didn’t even know existed.

Pranay
Head of Marketing, Hubilo

GrowthSpree’s AI platform has made reporting so easy. These custom reports are intuitive, and they’ve made decision-making so much faster.

Debpriya
Director of Marketing, Sogolytics

From budget leaks to performance issues, Agentic AI identified and fixed problems we didn't even know existed. It’s like having a dedicated analyst, but without the overhead.

The Solution

Our MCP + Your Claude(Free Version) = Your Personal 24x7 Marketing Analyst

1
10+ Hours Saved Weekly

Stop spending hours building reports—let Zipeline AI do the heavy lifting.

2
15+ Hours Saved Weekly

No more manually gathering insights or finalizing next steps—your AI analyst does it instantly.

3
Available 24/7 for Brainstorming

Get answers to any questions and brainstorm ideas anytime, day or night.

4
30X Faster Quarterly Plan Creation

Create a solid plan for the next quarter in minutes instead of hours.

Ready-to-Use AI Prompts

Start getting insights immediately with these pre-built analysis prompts

Ad Scheduling Analysis Using Google Ads MCP with Claude

Copy prompt

Analyze Google Ads account  for time-of-day and day-of-week performance differences in clicks and conversions. Identify top-performing hours and days based on CTR and conversion rate, and highlight inefficient windows where spend is less effective. Recommend ad scheduling strategies and pinpoint campaigns that show clear engagement peaks for schedule-based optimization. Instructions: Use only validated platform data, disclose any missing metrics, chunk large sets for aggregation, and base all insights and recommendations on direct data and logic. Provide a prioritized summary and action steps for improvement.

Loc, Device, Time Using Google Ads MCP with Claude

Copy prompt

Do a complete Google Ads account analysis for account ID. Focus on:

  • Campaign performance by location – country, state, or region breakdown of spends, CTR, and conversions.

  • Identify best and worst-performing locations and flag any exceptional campaign performance in specific areas.

  • Include device-level performance analysis showing where spend and results are concentrated (desktop, mobile, tablet).

  • Evaluate hour-of-day performance to detect strong or poor time windows, and determine if ad scheduling can improve results.

Instructions for all analyses:

  • Validate data directly from Google Ads; do not use sample or hypothetical numbers.

  • Disclose any metrics missing or unavailable due to system limitations.

  • Process large datasets in chunks for accurate aggregation.

  • Ensure every recommendation is supported by performance data and logical reasoning.

  • Conclude with a prioritized summary of findings, action steps, and expected improvements.

Keyword Spends Change Using Google Ads MCP with Claude

Copy prompt

Analyze Google Ads account data for drastic changes in keyword-level spends within campaigns over the last 30 days, compared to the previous 30-day period. Identify keywords with large increases or decreases in spend, and for top performing campaigns/adgroups, also check for drastic changes in keyword-level conversions. For each keyword with significant shifts, report monthly spend and results for “top last month” vs “top this month,” including bottom-performing keywords for both periods. Clearly show comparison tables for all metrics available (spend, impressions, clicks, conversions, CPC, CPL, etc.). Validate all data points directly from the platform. Disclose and explain any unavailable metrics or missing data due to system limitations. If data sets are too large, chunk the analysis and aggregate for final reporting. Support every finding and hypothesis with direct data and clear logic. Conclude the analysis with a concise prioritized summary of main findings and actionable next steps to improve keyword performance and account results.

Impression Share Report Using Google Ads MCP with Claude

Copy prompt

Analyze Google Ads data to identify all campaigns experiencing impression share loss, indicating whether loss is primarily due to ad rank or budget constraints. Present a clear table for each campaign showing:

  • Total Impression Share

  • Impression Share Lost (Rank/Budget)

  • Root Cause

  • Actionable Fixes (bid increase, ad quality, or budget changes)

For each campaign, also provide keyword-level and landing-page metrics for top and bottom performing keywords based on conversion performance, focusing on Keyword Ad Rank, impressions, clicks, conversions, and conversion rate.

Highlight keywords or landing pages with strong or poor performance and provide precise, actionable recommendations to improve impression share and conversion results.
Report any unavailable metrics or data limitations, and if large data sets exist, process them in chunks before aggregation.

General Instructions:

  • All numbers validated from Google Ads—no speculation or fabricated data.

  • Disclose incomplete metrics clearly.

  • All insights supported with specific metrics and logical reasoning.

  • End with an executive summary of root causes and prioritized next steps for higher performance.

CTR performance report Using Google Ads MCP with Claude

Copy prompt

Review Google Ads account data to identify any campaigns with drastic changes in CTR (Click-Through Rate) over the selected period. If no campaign shows significant CTR shifts, analyze top performing campaigns for adgroups with sharp CTR fluctuations. For all identified campaigns/adgroups, show CTR percentage change, associated impressions/clicks, and relevant date range. Next, list the ad headlines with the highest CTR in the account and recommend the top 2-3 headlines for implementation in low-CTR adgroups to improve performance. Additionally, provide detailed CTR analysis at the keyword and ad level, identifying both the best and worst performers, and highlight actionable recommendations with supporting data. Disclose any missing or partial data and, for large data sets, process in manageable chunks and aggregate at the end. Finish with a concise summary of drivers behind the CTR changes and prioritized, data-backed next steps for improvement.

General Instructions:

  • Validate all figures directly from the Google Ads dataset.

  • Clearly disclose metrics or dimensions that are unavailable or incomplete.

  • For large data blocks, aggregate for clarity.

  • Support all insights and recommendations with specific metrics and logic.

  • End with an executive summary and prioritized next actions for improvement.

TCPA Performance Report Using Google Ads MCP with Claude

Copy prompt

For every campaign using TCPA (Target Cost per Acquisition) bidding, compare the set TCPA to actual CPA from Google Ads performance. Highlight discrepancies, giving exact TCPA, actual CPA, and percentage variance for each campaign. Analyze reasons for over/under-performance (e.g., budget limits, conversion quality, targeting changes) using only validated campaign data. If data is missing or incomplete, state the limitation. End with actionable suggestions to increase or decrease TCPA settings to optimize results, with supporting rationale.

Instructions:

  • Always validate all numbers directly from Google Ads data before presenting.

  • Never use sample, simulated, or hypothetical data.

  • Disclose and explain any metrics or data points that are unavailable or limited because of system constraints.

  • If data sets are large, process them in chunks and aggregate results for clarity and completeness.

  • For each insight or recommended action, provide supporting data points and clear logic.

  • Finish every report with a concise, prioritized summary and next steps to improve account performance.

0 Spends Campaign Using Google Ads MCP with Claude

Copy prompt

Identify all campaigns in Google Ads with zero or drastically reduced spend in the selected period, reporting the percentage decrease and comparing to prior trends. For each, document reasons where visible in the data (paused status, budget change, eligibility issues, others) and highlight all relevant metrics. Note any missing data and explain limitations. Present a prioritized summary with root causes and steps to reactivate or reallocate spend as appropriate for account growth.

CPM Analysis Using Google Ads MCP with Claude

Copy prompt

Review all campaigns and keywords in Google Ads for any drastic increase in CPM (Cost Per Thousand Impressions) over the chosen time frame. For each case detected, display the CPM change percentage, impacted periods, and related performance metrics (impressions, clicks, conversions). Clearly explain possible drivers of CPM increases (e.g., auction pressure, targeting shifts, creative fatigue) with supporting data only. Disclose any data retrieval issues. End with concise recommendations to diagnose, monitor, or reduce CPM increases based on findings. Also, add auction insights and quality score reports within the existing report to make it more cohesive.

Spends Drop Report Using Google Ads MCP with Claude

Copy prompt

Analyze Google Ads account data for any drastic changes in campaign spends during the selected period. If no campaigns show drastic spend changes, check for adgroups with sharp spend fluctuations inside top-performing campaigns. For each identified campaign or adgroup, provide the percentage change, highlight the specific dates and metrics affected, and explain the likely reasons for these changes using only validated data. Flag any gaps or unavailable data. Conclude with a concise summary of the root cause and next-step recommendations for spend stabilization or optimization.

Instructions:

  • Always validate all numbers directly from Google Ads data before presenting.

  • Never use sample, simulated, or hypothetical data.

  • Disclose and explain any metrics or data points unavailable or limited because of system constraints.

  • If data sets are large, process them in chunks and aggregate results for clarity and completeness.

  • For each insight or recommended action, provide supporting data points and clear logic.

  • Finish every report with a concise, prioritized summary and next steps to improve account performance.

Geo/Location Report Using Google Ads MCP with Claude

Copy prompt

Generate a report using Google Ads data, the report should be for the month of September 2025 and the goal is to uncover top-performing countries, then drill down into state or county level to find both high-performing and underperforming geographies. Clearly indicate which locations drive the best results (CTR, conversions, CPL, ROAS) and which waste budget. For each geography, give detailed data, flag data gaps or retrieval issues, and explain the rationale for suggesting scale-up or exclusion. End with an actionable summary of where to increase investment and where to cut back, supporting each point with data.

Instructions:

  • Always validate data directly from Google Ads before presenting.

  • Never use hypothetical or sample data.

  • Disclose and explain any metrics or data points missing due to system limitations.

  • For large data sets, chunk the analysis and aggregate at the end for efficiency and completeness.

  • Each insight or recommendation must be supported by specific data points and a logical explanation.

  • Conclude each report with a clear, prioritized summary and next steps for improving results.

Search Term Report Using Google Ads MCP with Claude

Copy prompt

Analyze Google Ads search term data to identify high-potential search terms for addition as keywords, as well as search terms to be excluded. Highlight for the selected time frame which search terms delivered strong conversions and low CPL and which produced wasted spend or poor results. If search term data is too large, process in batches. Offer clear recommendations for inclusion and exclusion of search terms, and finish with a concise summary of actions and expected impact, explaining all logic and findings with supporting data points."

Instructions:

  • Validate all data directly from Google Ads before presenting.

  • Do not use hypothetical or sample data.

  • Flag and explain any missing metrics.

  • Chunk large datasets and aggregate findings for completeness.

  • Recommendations must be supported by specific data points and logical explanations.

  • Close with a prioritized summary and next steps for optimization.

Monthly Keyword Report Using Google Ads MCP with Claude

Copy prompt

Using Google Ads data, produce a keyword performance report for the user-defined time range. Rank and summarize best and worst performing keywords on key metrics (impressions, clicks, conversions, spend, CPL, ROAS) and compare results against the previous same-length period. Document all relevant data points and explain any changes in keyword effectiveness. If any keyword data is incomplete, flag the gap. Offer a final summary with recommendations for keyword optimization, including pausing or bidding changes.

Instruction to generate report:

  • Always validate data directly from Google Ads before presenting.

  • Never use hypothetical or sample data in any output.

  • Disclose and explain any metrics or data points missing due to system limitations.

  • For large data sets, chunk the analysis and aggregate at the end for efficiency and completeness.

  • Each insight or recommendation must be supported by specific data points and a logical explanation.

  • Conclude each report with a clear, prioritized summary and next steps for improving results.

Weekly Report Using Google Ads MCP with Claude

Copy prompt

Analyze Google Ads data to generate a weekly campaign performance comparison, showing improvement or decline week over week. For each campaign, identify the main metrics (spend, clicks, CPC, CTR, conversions, CPL, ROAS) that led to the change. Explain underlying causes for shifts in performance, referencing only data that is valid and available. If any campaign data cannot be retrieved, clearly note the limitation. If the data is too large, split and process in chunks, then aggregate the results. End with a data-driven summary and actionable recommendations for the next week.

Instructions to generate the report:

  • Always validate data directly from Google Ads before presenting.
  • Never use hypothetical or sample data in any output.
  • Disclose and explain any metrics or data points missing due to system limitations.
  • For large data sets, chunk the analysis and aggregate at the end for efficiency and completeness.
  • Each insight or recommendation must be supported by specific data points and a logical explanation.
  • Conclude each report with a clear, prioritized summary and next steps for improving results.

Frequently Asked Questions

What is Google Ads MCP?

keyboard_arrow_down

Google Ads MCP (Model Context Protocol) is a modern, AI-integrated layer built to make managing, optimizing, and analyzing your Google Ads campaigns smarter, faster, and more intuitive.

How is this different from Google's MCC (My Client Center)?

keyboard_arrow_down

While MCC gives you access to multiple accounts, MCP adds AI-driven intelligence, contextual understanding, and automated insights on top of that data. It’s like MCC, but supercharged.

Who is this platform for?

keyboard_arrow_down

The platform is ideal for:

  • Agencies managing multiple clients
  • PPC professionals and freelancers
  • Growth marketers and in-house teams
  • Anyone looking to reduce manual ad analysis and boost performance

What role does Claude play in MCP?

keyboard_arrow_down

Claude is integrated directly into the platform to help:

  • Analyze campaign performance
  • Surface optimization opportunities
  • Interpret performance metrics in plain English
  • Generate ad copy or A/B test variants
  • Answer your marketing questions conversationally

Can Claude suggest improvements to my campaigns?

keyboard_arrow_down

Yes! Claude can recommend bid adjustments, pause underperforming keywords, highlight low-ROAS campaigns, and even suggest new audiences to test — all based on your data.

Will Claude generate an ad copy?

keyboard_arrow_down

No, this is not supported in current version

Does Claude understand natural language?

keyboard_arrow_down

Absolutely. Ask questions like:

  • "Which campaigns dropped in performance last week?"
  • "What ad creatives are converting best?"
  • "Give me 3 new headline variations for my top-performing ad set."
  • Generate ad copy or A/B test variants
  • Answer your marketing questions conversationally

What kind of insights does MCP provide?

keyboard_arrow_down

You get:

  • "Real-time campaign insights"
  • "AI-powered recommendations"
  • "Natural language reporting"
  • Budget efficiency analysis
  • ROAS trends and forecasts

Can I connect multiple Google Ads accounts?

keyboard_arrow_down

Yes. The platform supports unlimited Google Ads account connections using your Google MCC.

Do I need technical skills to use it?

keyboard_arrow_down

Not at all. The interface is user-friendly, and Claude simplifies everything by letting you query your data conversationally.

Is reporting included?

keyboard_arrow_down

Yes. Generate one-click reports for internal use or clients. You can even ask Claude to summarize performance in bullet points or in a client-ready paragraph format.

Is my Google Ads data secure?

keyboard_arrow_down

Yes. We use industry-standard encryption (TLS/SSL), secure OAuth 2.0 authentication, and follow best practices for data storage and access control.

Is my data used to train Claude or other models?

keyboard_arrow_down

No. Your data is never used to train AI models, including Claude. All processing happens securely within your session.

Is there a free trial available and what is the cost?

keyboard_arrow_down

This is an open source version and fully free, which will be hosted on your desktop

How long does setup take?

keyboard_arrow_down

You can be up and running in under 5 minutes. Simply connect your Google Ads account and start receiving insights instantly.

Do you offer onboarding support?

keyboard_arrow_down

Yes. Book a 15 minutes call with us here

What is Google Analytics MCP?

keyboard_arrow_down

Google Analytics MCP (Model Context Protocol) is an AI-powered layer that connects to your GA4 property and lets you analyze traffic, conversions, user behavior, and more through a simple conversational interface. Ask questions in plain English, get answers instantly.

How is this different from Google's MCC (My Client Center)?

keyboard_arrow_down

While MCC gives you access to multiple accounts, MCP adds AI-driven intelligence, contextual understanding, and automated insights on top of that data. It’s like MCC, but supercharged.

Who is this platform for?

keyboard_arrow_down

The platform is ideal for:

  • Agencies managing multiple clients
  • PPC professionals and freelancers
  • Growth marketers and in-house teams
  • Anyone looking to reduce manual ad analysis and boost performance

What role does Claude play in MCP?

keyboard_arrow_down

Claude is integrated directly into the platform to help:

  • Analyze campaign performance
  • Surface optimization opportunities
  • Interpret performance metrics in plain English
  • Generate ad copy or A/B test variants
  • Answer your marketing questions conversationally

Can Claude suggest improvements to my campaigns?

keyboard_arrow_down

Yes! Claude can recommend bid adjustments, pause underperforming keywords, highlight low-ROAS campaigns, and even suggest new audiences to test — all based on your data.

Will Claude generate an ad copy?

keyboard_arrow_down

No, this is not supported in current version

Does Claude understand natural language?

keyboard_arrow_down

Absolutely. Ask questions like:

  • "Which campaigns dropped in performance last week?"
  • "What ad creatives are converting best?"
  • "Give me 3 new headline variations for my top-performing ad set."
  • Generate ad copy or A/B test variants
  • Answer your marketing questions conversationally

What kind of insights does MCP provide?

keyboard_arrow_down

You get:

  • "Real-time campaign insights"
  • "AI-powered recommendations"
  • "Natural language reporting"
  • Budget efficiency analysis
  • ROAS trends and forecasts

Is reporting included?

keyboard_arrow_down

Yes. Generate one-click reports for internal use or clients. You can even ask Claude to summarize performance in bullet points or in a client-ready paragraph format.

Can I connect multiple Google Ads accounts?

keyboard_arrow_down

Yes. The platform supports unlimited Google Ads account connections using your Google MCC.

Do I need technical skills to use it?

keyboard_arrow_down

Not at all. The interface is user-friendly, and Claude simplifies everything by letting you query your data conversationally.

How long does setup take?

keyboard_arrow_down

You can be up and running in under 5 minutes. Simply connect your Google Ads account and start receiving insights instantly.

Is reporting included?

keyboard_arrow_down

Yes. Generate one-click reports for internal use or clients. You can even ask Claude to summarize performance in bullet points or in a client-ready paragraph format.

Is my data used to train Claude or other models?

keyboard_arrow_down

No. Your data is never used to train AI models, including Claude. All processing happens securely within your session.

Is there a free trial available and what is the cost?

keyboard_arrow_down

This is an open source version and fully free, which will be hosted on your desktop

Do you offer onboarding support?

keyboard_arrow_down

Yes. Book a 15 minutes call with us here

Stop Guessing. Start Today.

Join 150+ marketers who've improved their Meta Ads ROAS with AI-powered insights.

Get Your Answers Today!
No credit card required • Setup in 30 seconds
Thank you! Your submission has been received!
Oops! Something went wrong while submitting the form.
Onboard Today!