The Leading Indicators for Paid Media on Long Sales Cycles: What to Watch Before Revenue Lands (B2B SaaS)
Quick answer: On a long B2B SaaS sales cycle, the revenue that proves a paid campaign worked lands months after you spend the money — so if you wait for revenue to optimize, you’re steering with a rear-view mirror. The solution is a ladder of leading indicators, each of which predicts revenue at a known lead time: engagement and account-engagement signals appear first (~30–60 days), lead velocity rate and pipeline-value-created next (predicting bookings ~60–90 days out), then SQL volume-and-quality and pipeline coverage, with revenue and win rate lagging by 6–12 months. Watching these predictive proxies — not final revenue — lets you steer paid in the months-long gap before deals close. The discipline: pick the leading indicators that genuinely predict revenue for your funnel, watch 4–8-week trends (not weekly noise), and never conclude a long-cycle campaign failed from a revenue number that hasn’t had time to exist.
Key takeaways
- Revenue lags spend by months on long cycles — you can’t optimize on it in real time.
- Use a ladder of leading indicators, each predicting revenue at a known lead time.
- Earliest signals: engagement (~30–60 days); then LVR and pipeline created (~60–90 days out).
- Pipeline-value-created is the correct revenue proxy once cycles exceed 30 days.
- Watch 4–8-week trends, not weekly noise — and validate each proxy predicts revenue for you.
There’s a specific, painful gap in long-cycle paid media: you spend the money now, but the revenue that tells you whether it worked won’t appear for 3–9 months. Most teams handle this badly — they either fly blind or judge campaigns on revenue that hasn’t had time to materialize and cut them prematurely. The fix isn’t better attribution of the result (covered elsewhere); it’s watching the right predictive metrics in the meantime. This is the ladder of leading indicators for paid on long cycles — what to watch, what each one forecasts, and when. (For measuring the eventual result, see the cohort-ROAS and long-cycle playbook guides; this post is about the proxies you steer on before the result exists.)
Why leading indicators, not revenue, steer long-cycle paid
Because on a long cycle, revenue is a lagging indicator that arrives too late to act on. If your sales cycle is 84 days (and up to 281 for LinkedIn-influenced deals), the revenue from this month’s spend won’t be visible for a quarter or more — so optimizing on revenue means every decision is a quarter late. Worse, judging a campaign on revenue before the cycle has elapsed guarantees a false negative: at 30 days, only 5–15% of eventual revenue has been recognized, so the campaign looks like a failure during exactly the window when it’s working as designed. The way out is to steer on leading indicators — metrics that appear early and reliably predict the revenue to come — so you can course-correct in the gap. The mental model: lagging metrics (revenue, win rate, closed ARR) show the past; leading metrics (engagement, lead velocity, pipeline created) point to what’s coming. On long cycles, you manage paid on the leading metrics and confirm on the lagging ones — never the reverse.
The ladder: which metrics predict revenue, and when
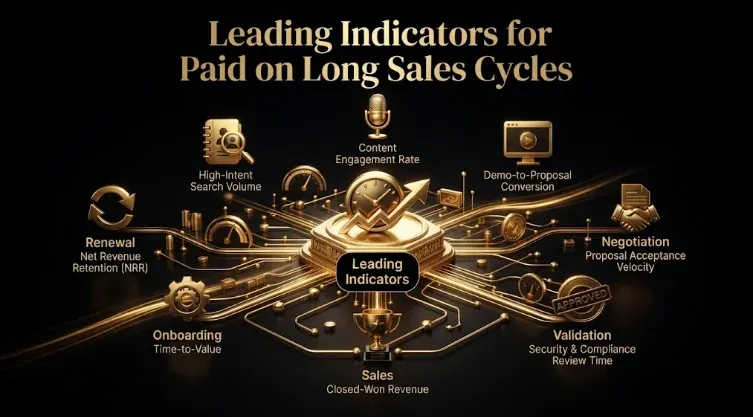
Leading indicators form a ladder, each rung closer to revenue and each with its own lead time — the amount of warning it gives you before revenue moves:
| Rung (earliest → latest) | Metric | Typical lead time | What it predicts |
|---|---|---|---|
| 1 | Engagement / account-engagement score | ~30–60 days | Whether the right accounts are paying attention |
| 2 | Lead velocity rate (LVR) | leading | Future qualified-lead and pipeline momentum |
| 3 | Pipeline value created | ~15–30 days ahead of bookings | Bookings 60–90 days out |
| 4 | SQL volume + quality | ~30–45 days | Near-term pipeline conversion |
| 5 | Pipeline coverage ratio | ~15–30 days | Whether you have enough pipeline to hit quota |
| — | Revenue, win rate (lagging) | 6–12 months | Confirms — too late to steer |
The insight that makes this actionable: each metric predicts revenue at a specific lead time, so a change you see now forecasts a revenue change later. Website traffic and lead generation this month predict revenue a couple of quarters out; pipeline created this month predicts bookings 60–90 days out; SQL trends this month predict next month’s pipeline. So instead of waiting for the revenue number, you read the rung of the ladder whose lead time matches the decision you need to make — and you get an early, directional read on whether this month’s paid spend is building toward revenue or not. The higher rungs (engagement, LVR) give the most warning but the loosest signal; the lower rungs (SQL quality, coverage) give less warning but tighter signal. Watch the whole ladder, weighted toward the rungs that have historically predicted revenue for your funnel.
The two most useful rungs: Lead Velocity Rate and Pipeline Value Created
Two rungs deserve special attention because they’re the most predictive and least gamed.
Lead Velocity Rate (LVR) measures month-over-month growth in qualified leads: (this month’s qualified leads − last month’s) ÷ last month’s × 100. It’s a pure leading indicator of pipeline momentum — an LVR of 15%+ signals healthy momentum, and consistent 20%+ signals strong demand. Because it measures the rate of change in qualified lead flow, it turns before pipeline and revenue do: a declining LVR often signals revenue trouble two to three months before it shows up in MRR — giving you the earliest reliable read on whether paid is building or stalling, with enough lead time to act.
Pipeline Value Created — the total dollar value of opportunities opened in a period, by source — is the single correct revenue proxy once your sales cycle exceeds 30 days. It’s the earliest metric that’s genuinely dollar-denominated and CFO-credible: it predicts bookings 60–90 days out, and it lets you judge paid on pipeline generated per dollar (pipeline ROAS) long before closed-won revenue exists. For paid specifically, pipeline value created by channel/campaign is the metric to optimize toward in the gap — it’s close enough to revenue to be trustworthy but early enough to act on.
Together, LVR (momentum) and pipeline value created (dollar-denominated proxy) are the workhorse leading indicators for long-cycle paid: LVR tells you the flow of qualified demand is growing or shrinking, and pipeline value created tells you what that demand is worth and when it’ll book. If you watch only two things in the gap before revenue, watch these.
How to steer paid on leading indicators without being fooled
Leading indicators are powerful but easy to misuse — here’s how to use them well:
- Validate each proxy actually predicts revenue for you. A leading indicator is only useful if it has historically preceded revenue in your funnel. Check the correlation before trusting it — engagement that never converts to pipeline is a vanity metric, not a leading indicator. This matters more in 2026 because AI is decaying the old top-of-funnel proxies: buyers now do ~60% of their evaluation before talking to sales, increasingly off your owned channels and inside AI summaries, so raw traffic and generic engagement are losing predictive value (which is why many teams now see rising engagement alongside flat or declining pipeline). Shift your ladder toward pipeline-proximate, intent-rich signals — demo requests, CRM-sourced leads, gated-asset downloads, predictive lead scores, and role-based engagement — and away from raw traffic that AI Overviews may be quietly eroding.
- Match the rung to the decision’s timeframe. Use the metric whose lead time fits the decision: engagement/LVR for early directional reads, pipeline created for budget decisions 1–2 quarters out.
- React to 4–8-week trends, not weekly fluctuations. Leading indicators are noisy week to week; the signal is in the multi-week trend. Weekly reactions create thrash.
- Watch the whole ladder together. One rung can mislead (rising engagement with flat pipeline created is a warning, not a win); multiple rungs trending together is a real signal.
- Confirm on lagging metrics, don’t steer on them. Use revenue, win rate, and cohort ROAS to validate that the leading indicators predicted correctly — and to recalibrate which proxies to trust — but make the in-flight decisions on the leading ones.
- Keep pipeline definitions honest. Pipeline value created is only a good proxy if pipeline is qualified consistently; loose qualification turns it into a vanity number that predicts nothing.
The discipline is to treat leading indicators as an early-warning system you steer by, and lagging metrics as the confirmation you learn from — while constantly checking that your chosen proxies genuinely predict your revenue. Done right, this closes the long-cycle gap: you get to course-correct paid in months 1–3 instead of discovering at month 9 that a quarter of spend was misallocated.
Field note: The hardest thing about long-cycle paid isn’t the length of the cycle — it’s the temptation to keep checking the revenue number, which is precisely the number that can’t help you yet. Spend the money in January and the revenue verdict arrives around May; if you manage the campaign by watching for that revenue, you’ll spend February, March, and April either flying blind or, worse, “correcting” based on a revenue figure that’s structurally incomplete. The teams that manage long cycles well do something that feels counterintuitive: they mostly ignore revenue in-flight and watch a ladder of leading indicators instead — is engagement from the right accounts rising, is lead velocity positive, is pipeline value created growing by channel — because those metrics move first and predict the revenue that’s coming. The single best habit is to watch pipeline value created by channel as your primary in-flight proxy and lead velocity rate as your momentum gauge, react to 4–8-week trends rather than weekly noise, and reserve the revenue number for confirming (months later) that your leading indicators were pointing the right way. The revenue will come; your job in the gap is to read the metrics that tell you it’s coming, and steer on those. Managing long-cycle paid on revenue is like driving by looking only in the rear-view mirror — the leading-indicator ladder is the windshield.
Honest limitations
- Leading indicators can mislead. Engagement or lead volume that never converts is a vanity metric; validate that each proxy has historically predicted revenue for your funnel.
- This is the proxy-metrics layer. Measuring the eventual result (cohort ROAS, attribution windows) and the full long-cycle strategy are covered separately; this post is specifically the leading-indicator ladder.
- Lead times vary by funnel. The ~30–90-day lead times are directional; map your own customer journey to know which metric predicts revenue at what lead time.
- Definitions must be consistent. Pipeline value created and SQL quality are only good proxies if qualification is defined and applied consistently.
- Educational, not investment or financial advice — validate against your own data.
Frequently Asked Questions
Q1. Why should you steer long-cycle paid on leading indicators instead of revenue?
Because on a long cycle revenue is a lagging indicator that arrives too late to act on — if your cycle is 84 days (up to 281 for LinkedIn-influenced deals), this month’s spend won’t show revenue for a quarter or more, so optimizing on revenue makes every decision a quarter late. Worse, at 30 days only 5–15% of eventual revenue has been recognized, so judging a campaign on revenue before the cycle elapses guarantees a false negative. Leading indicators appear early and predict the revenue to come, letting you course-correct in the gap.
Q2. What are the leading indicators for paid media on long cycles?
A ladder, each rung closer to revenue with its own lead time: engagement/account-engagement score (~30–60 days — are the right accounts paying attention), lead velocity rate (momentum of qualified leads), pipeline value created (predicts bookings 60–90 days out — the correct proxy once cycles exceed 30 days), SQL volume and quality (~30–45 days), and pipeline coverage ratio. Revenue and win rate lag by 6–12 months and only confirm. You watch the ladder and read the rung whose lead time matches the decision you need to make.
Q3. What is Lead Velocity Rate and why does it matter?
Lead Velocity Rate (LVR) is the month-over-month growth in qualified leads: (this month’s qualified leads − last month’s) ÷ last month’s × 100. It’s a pure leading indicator of pipeline momentum — 15%+ signals healthy momentum, consistent 20%+ signals strong demand. Because it measures the rate of change in qualified lead flow, it turns before pipeline and revenue do, giving the earliest reliable read on whether paid is building or stalling. It’s one of the two workhorse leading indicators for long-cycle paid, alongside pipeline value created.
Q4. What’s the best revenue proxy when the sales cycle is long?
Pipeline value created — the total dollar value of opportunities opened in a period, by source — is the single correct revenue proxy once your sales cycle exceeds 30 days. It’s the earliest genuinely dollar-denominated, CFO-credible metric: it predicts bookings 60–90 days out and lets you judge paid on pipeline generated per dollar (pipeline ROAS) long before closed-won revenue exists. For paid, optimize toward pipeline value created by channel/campaign in the gap — close enough to revenue to trust, early enough to act on.
Q5. How do you avoid being fooled by leading indicators?
Validate each proxy actually predicts revenue in your funnel (engagement that never converts is vanity, not a leading indicator), match the metric’s lead time to your decision, react to 4–8-week trends rather than weekly noise, watch the whole ladder together (one rung can mislead — rising engagement with flat pipeline is a warning), confirm on lagging metrics without steering on them, and keep pipeline definitions consistent (loose qualification makes pipeline value created a vanity number). Treat leading indicators as an early-warning system and lagging metrics as confirmation you learn from.
Q6. How often should you review leading indicators?
On a 4–8-week trend basis, not weekly. Leading indicators are noisy week to week, so weekly reactions create thrash and false signals; the real signal is in the multi-week trend. Review the ladder regularly (weekly viewing is fine) but act on 4–8-week movements, and look for multiple rungs trending together before making a budget change. This matches the cadence of long-cycle paid, where genuine shifts play out over weeks, not days.
Q7. How is this different from cohort ROAS or attribution windows?
Cohort ROAS and attribution windows measure the result — the revenue a cohort eventually produces, over time. Leading indicators are the predictive proxies you watch before the result exists, to steer in the gap. They’re complementary: leading indicators (engagement, LVR, pipeline created) tell you in months 1–3 whether spend is building toward revenue; cohort ROAS confirms months later whether it did, and recalibrates which proxies to trust. Use leading indicators to steer in-flight; use cohort ROAS to confirm and learn.
Sources & further reading
- CFO Pro Analytics (leading indicators predict revenue at specific lead times; “January traffic predicts May revenue”); SaaSHero (pipeline ROAS as early signal; engagement→pipeline→revenue ABM ladder with 30-60/60-90 day/6-12 month lead times).
- SaaSHero lead-gen metrics (Lead Velocity Rate ≥15% healthy; pipeline value created as the correct proxy when cycles exceed 30 days); B2B Ecosystem (leading vs lagging metric framing).
- Companion: How to Measure ROAS (cohort/window — the result); The Long-Sales-Cycle Paid Media Playbook (the strategy); Pipeline Velocity for B2B SaaS.
This guide is educational, not investment or financial advice; leading indicators can mislead and lead times vary by funnel, so validate that each proxy predicts your revenue and confirm on lagging metrics.
Related guides: The Long-Sales-Cycle Paid Media Playbook for B2B SaaS · Pipeline Velocity for B2B SaaS · B2B SaaS Paid Ads Ramp-Up Benchmarks: Time-to-Pipeline · How to Measure ROAS for B2B SaaS: 30-Day vs 180-Day vs LTV-Adjusted · Cost per Opportunity & Pipeline-per-Dollar Benchmarks.