ChatGPT
 Gemini
 Claude
 Perplexity
 DeepSeek
 Grok
Grok
The Cross-Platform Paid Waste Benchmark for B2B SaaS 2026: Why Google, LinkedIn & Meta Each Leak Differently
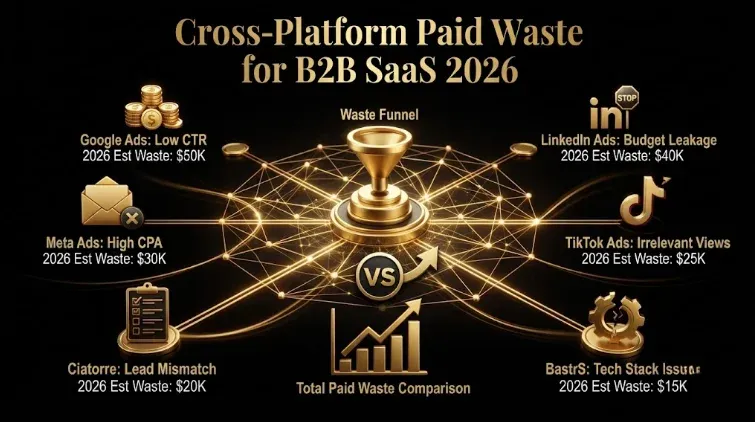
Quick answer: B2B SaaS wastes a large, benchmarked share of paid budget on every major platform — roughly 25–40% on Google Ads (top-quartile accounts still 10–18%), about 32% on LinkedIn, and a comparable share on Meta — but the single most important finding is that each platform wastes budget in a completely different place. Google Ads waste hides in measurement (broad match plus smart bidding optimizing to the wrong conversion signal). LinkedIn Ads waste hides in targeting (paying to reach non-ICP job functions, mislabeled seniority, and sub-50-employee companies — with only about a third of budget reaching actual decision-makers). Meta waste hides in audience quality (broad lookalike and interest targeting reaching non-buyers). So there’s no single waste-reduction playbook: you have to diagnose each platform where it actually leaks — and there’s a fourth, cross-platform leak (measurement blindness) that hides between the channels.
Key takeaways
- Google Ads waste ≈ 25–40% (top quartile 10–18%) — hides in measurement.
- LinkedIn Ads waste ≈ 32% — hides in targeting (only ~33% reaches decision-makers).
- Meta waste is comparable — hides in audience quality (broad lookalikes reaching non-buyers).
- Each platform leaks in a different place — one playbook can’t fix all three.
- A fourth leak hides between platforms — cross-platform measurement blindness (20–40% of influence).
Most “wasted ad spend” content treats waste as one problem with one fix (add negative keywords, tighten targeting). For B2B SaaS running multiple channels, that’s wrong — and expensively so, because the platforms fail in structurally different ways. This is the cross-platform waste benchmark: how much each channel wastes, where each one leaks, the fourth leak that hides between them, and the fix sequence that works across all of them. (It synthesizes the platform-specific waste reports; see those for each channel’s full root-cause breakdown.)
How much do B2B SaaS platforms actually waste?
The benchmarked waste rates, by platform:
| Platform | Typical waste | Top-quartile | Where it hides | Primary root cause |
|---|---|---|---|---|
| Google Ads | ~25–40% | ~10–18% | Measurement | Broad match + smart bidding on wrong signal |
| LinkedIn Ads | ~32% avg | ~12% (post-fix) | Targeting | Non-ICP audiences; ~67% reaching non-buyers |
| Meta | 40–70% (cold interest); low with retargeting | — | Audience quality | Broad interest/lookalike reaching non-buyers |
| Cross-platform | 20–40% of influence | — | Attribution | No cross-platform/CRM measurement |
These come from large, named B2B SaaS datasets — a $11.3M Google Ads waste analysis across 43 accounts (25–40% typical waste, 30–45% for smaller $25K–$100K accounts), and a LinkedIn Ads waste study of $9.4M across 56 accounts (32.0% average, roughly $53,600 wasted per account). Two honest caveats. First, waste is scale-dependent: enterprise advertisers with dedicated data-ops teams drive waste below the median, while seed-stage founders running small budgets typically sit above it — so benchmark your own number rather than assuming the average applies. Second, these are agency-composite datasets (accounts that fired their agency aren’t in them), and no independent randomized study of B2B ad waste exists yet — treat the figures as strong directional benchmarks, not laboratory constants. What isn’t in doubt is the headline: a quarter to a third of B2B SaaS paid budget is typically wasted, on every platform — and the location of that waste differs by platform, which is the actionable part.
Google Ads: waste hides in measurement
On Google, the money doesn’t mostly leak on obviously-wrong clicks — it leaks because the account is optimizing toward the wrong thing. Broad match plus smart bidding, left to Google’s defaults, chases the cheapest conversions, which in B2B are the lowest-quality form-fills; conversion tracking is often broken (duplicate tags, count set to “every,” a 30-day window that misses an 84-day sales cycle); and branded search frequently eats 40%+ of spend while being reported as the “best” campaign (it converts because those buyers were already coming). The result is an account that looks efficient on its dashboard while systematically buying junk — waste that’s invisible until you reconcile ad-platform conversions against CRM-accepted pipeline. This is why Google waste “hides in measurement”: you can’t see it in the platform, only in the gap between platform conversions and real pipeline. The fixes are measurement-first — reconcile to CRM, fix tracking, extend the window, feed qualified-pipeline signal, and mine the search-terms report — not “tighten targeting,” which is the LinkedIn fix, not the Google one.
LinkedIn Ads: waste hides in targeting
On LinkedIn, waste is the opposite — it’s not hidden in measurement, it’s sitting in plain sight in the targeting, and the platform charges you for every wrong click. The LinkedIn waste study found that just three targeting root causes drive about 67% of all waste: non-ICP job-function targeting (sales and BDR reps are the single largest wasted category — LinkedIn’s most active, easiest-to-reach users, who rarely hold buying authority), seniority mislabeling, and company-size leakage into sub-50-employee firms. The devastating summary stat: only about 33% of LinkedIn budget reaches actual decision-makers, against a healthy target of 60%+ — meaning two of every three dollars go to people who couldn’t sign the contract if they wanted to. This isn’t a sophisticated optimization gap; it’s accounts that never excluded sales reps. Because LinkedIn’s default audience is far too broad, the fixes are targeting-first: exclusion lists (job functions, seniority, company size), tighter audience construction, dayparting (pausing dead hours recovers 20–30%), and company-level frequency capping. Applied across the dataset, this cut average waste from 32.0% to 11.8%, recovered $1.9M, and lifted decision-maker budget share from 33% to 61%. Running Google’s measurement-first playbook on LinkedIn would miss almost all of this.
Meta: waste hides in audience quality
Meta is the third pattern, and its waste is bimodal — used one way it’s among the most wasteful channels in B2B; used another it’s among the most efficient. The benchmark is stark: B2B advertisers who use Meta for cold, interest-based targeting waste 40–70% of budget, while those who use it for retargeting and lookalikes seeded on closed-won deals achieve 3.0–7.0x 180-day ROAS. Same platform, opposite outcomes — because Meta’s structural strength for B2B is cheap retargeting and CRM-lookalike reach, while its structural weakness is that broad B2B prospecting reaches huge numbers of non-buyers (Meta lacks LinkedIn’s job-title data, so its cold B2B audience signal is weak). So Meta waste concentrates in audience quality, with a few specific, common causes: running cold interest prospecting at all (the 40–70% waste zone); using Advantage+/broad targeting without the conversion volume it needs (it wants ~50+ conversions/week, and most B2B SaaS generates only 20–30 leads/week, so the algorithm never learns); building lookalikes from weak seeds (all leads, website visitors, or work-email lists that fail to match Meta accounts) instead of closed-won customers; and failing to exclude recent buyers (which alone wastes ~12% of the average B2B budget on redundant impressions). The Meta fix is audience-quality-first: lean on retargeting over cold prospecting, seed lookalikes on closed-won CRM data, feed qualified-conversion signal, exclude recent buyers, and — since under broad delivery the creative effectively is the targeting — use ICP-filtering creative to steer the algorithm. A different leak, a different fix: measurement discipline (the Google fix) and exclusion lists (the LinkedIn fix) help less here than fixing the audience source.
The fourth leak: cross-platform measurement blindness
The most overlooked waste isn’t on any single platform — it hides between them. B2B buyers touch multiple channels before converting, so 20–40% of pipeline influence is cross-platform, and without measurement connecting the platforms to each other and to the CRM, that influence is invisible. The consequence is a distinct, expensive kind of waste: you cut the wrong channel. LinkedIn creates demand that converts on a branded Google search weeks later; last-click credits Google, LinkedIn looks unprofitable, you cut LinkedIn — and the branded Google conversions dry up. This cross-platform blindness causes budget to be misallocated across channels even when each channel’s internal targeting and measurement are clean. The fix is cross-platform, CRM-connected attribution (connecting LinkedIn + Google + Meta + the CRM) so you can see which channels actually influence pipeline before you cut anything. This fourth leak is why platform-by-platform waste audits, however good, still leave money on the table — the biggest misallocation is often the one no single platform can show you.
The one thing that’s universal: the fix sequence
Although each platform leaks in a different place, the order of fixes is the same everywhere, and getting the order wrong is itself a source of waste: exclusions and fixes first, bids second, funding last. The logic is that adding budget (funding) or optimizing bids on top of a wasteful account just scales the waste — you have to stop the leak before you turn up the pressure. So on every platform: first eliminate the waste (fix Google’s measurement, LinkedIn’s targeting, Meta’s audience, and the cross-platform blindness), then optimize bids against the now-clean signal, then increase spend against the now-efficient account. The most common expensive mistake in B2B SaaS paid is doing this backwards — pouring more budget into an account wasting a third of it, which produces more waste, not more pipeline. Fix the leaks in their platform-specific places, in the right order, and the recovered budget (often 15–20 points of waste, worth real money on any meaningful spend) becomes available for genuine growth.
Field note: The reason “reduce your wasted ad spend” advice so often fails B2B SaaS teams is that it’s almost always written for one platform and quietly assumes the leak is in the same place everywhere. It isn’t. We can see this clearly in the benchmark data: on Google, waste hides in measurement — the account looks fine and is quietly buying junk that only the CRM reveals. On LinkedIn, waste hides in targeting — it’s sitting right there in the audience, two-thirds of the budget reaching people who can’t buy, because nobody excluded the sales reps. On Meta, waste hides in audience quality — broad prospecting reaching non-buyers because the B2B signal is weak. Three platforms, three completely different failure modes, three different fixes — and a fourth leak that hides between all of them, where the real channel-mix mistakes get made. A team that runs the same waste-reduction checklist on all three will fix one platform and miss the other two, then conclude the channels “don’t work.” The teams that actually recover the wasted third do something less satisfying but more effective: they diagnose each platform where it leaks, fix in the exclusions-then-bids-then-funding order, and connect the platforms so they can see the cross-platform influence before cutting anything. Waste isn’t one problem with one fix. It’s three platform-specific problems plus a measurement problem — and knowing where each one hides is most of the battle.
Honest limitations
- These are agency-composite benchmarks. The figures come from managed-account datasets (not randomized studies), so treat them as strong directional benchmarks and validate against your own accounts.
- Waste is scale-dependent. Enterprise data-ops teams run below the median; seed-stage advertisers above it — benchmark your own number.
- Beware unverifiable waste figures. Some widely-circulated round numbers (e.g., “64%” or “80%” wasted) can’t be traced to a named methodology; the figures here come from sourced datasets, but treat any waste stat without a clear source and date skeptically.
- Cross-platform influence is hard to measure. The 20–40% figure depends on attribution methodology; the direction (significant cross-platform influence is invisible to last-click) is robust, the exact number less so.
- Educational, not investment or financial advice — validate against your own accounts.
Frequently Asked Questions
Q1. How much of B2B SaaS paid budget is wasted?
A large, benchmarked share on every platform: roughly 25–40% on Google Ads (top-quartile accounts still 10–18%, smaller accounts 30–45%), about 32% on LinkedIn (roughly $53,600 per account in one 56-account study), and a comparable share on Meta. So a quarter to a third of B2B SaaS paid budget is typically wasted. But waste is scale-dependent — enterprise data-ops teams run below the median, seed-stage advertisers above it — so benchmark your own number rather than assuming the average applies.
Q2. Where does Google Ads waste come from for B2B SaaS?
Google waste hides in measurement — the account optimizes toward the wrong thing rather than leaking on obviously-wrong clicks. Broad match plus smart bidding chases the cheapest conversions (in B2B, the lowest-quality form-fills), conversion tracking is often broken (duplicate tags, wrong count settings, a 30-day window missing an 84-day cycle), and branded search eats 40%+ of spend while being reported as the “best” campaign. It’s invisible in the platform and only shows up when you reconcile ad-platform conversions against CRM-accepted pipeline — which is why the fixes are measurement-first.
Q3. Where does LinkedIn Ads waste come from?
LinkedIn waste hides in targeting, in plain sight. Three root causes drive about 67% of it: non-ICP job-function targeting (sales/BDR reps are the largest wasted category — active, easy to reach, but rarely buyers), seniority mislabeling, and company-size leakage into sub-50-employee firms. The result: only about 33% of budget reaches actual decision-makers, against a 60%+ target — two of every three dollars go to people who can’t sign the contract. The fixes are targeting-first: exclusion lists, tighter audiences, dayparting, and frequency capping, which cut waste from 32% to under 12% in the benchmark dataset.
Q4. Why does each platform waste budget in a different place?
Because their structures differ. Google is intent-and-automation-driven, so its waste is in the measurement and signal that feed automation (optimizing to the wrong conversion). LinkedIn charges for reaching a precisely-targetable professional audience, so its waste is in loose targeting that pays to reach non-buyers. Meta’s B2B audience signal is weak, so its waste is in broad prospecting reaching non-ICP users. Same headline waste rate (~25–40%), three structurally different failure modes — which is why one waste-reduction playbook can’t fix all three; you diagnose each where it actually leaks.
Q5. What is cross-platform waste and why is it the most overlooked?
Cross-platform waste hides between the channels: 20–40% of B2B pipeline influence is cross-platform, and without measurement connecting the platforms to each other and the CRM, that influence is invisible — so you cut the wrong channel. Classic example: LinkedIn creates demand that converts on a branded Google search weeks later; last-click credits Google, LinkedIn looks unprofitable, you cut it, and the branded Google conversions dry up. It’s the most overlooked because no single platform’s audit can show it — you need cross-platform, CRM-connected attribution to see channel influence before cutting.
Q6. What’s the right order to fix wasted ad spend?
Exclusions and fixes first, bids second, funding last — the same order on every platform. Adding budget or optimizing bids on top of a wasteful account just scales the waste, so you must stop the leak before turning up the pressure: first eliminate waste (Google’s measurement, LinkedIn’s targeting, Meta’s audience, the cross-platform blindness), then optimize bids against the clean signal, then increase spend against the efficient account. The most common expensive mistake is doing it backwards — pouring more budget into an account wasting a third of it, which produces more waste, not more pipeline.
Q7. Can you use the same waste-reduction playbook across Google, LinkedIn, and Meta?
No — that’s the core mistake. Each platform leaks in a different place, so the same checklist fixes one and misses the others. Google needs measurement fixes (CRM reconciliation, tracking, signal, search-terms mining); LinkedIn needs targeting fixes (exclusion lists, audience construction, dayparting, frequency capping); Meta needs audience-quality fixes (first-party CRM data, retargeting over cold prospecting). Only the fix order (exclusions, then bids, then funding) is universal. Diagnose each platform where it actually leaks, plus the cross-platform measurement blindness between them.
Sources & further reading
- GrowthSpree 2026 waste reports: $11.3M Google Ads Waste Report (43 accounts; 25–40% typical waste, 30–45% smaller accounts; waste hides in measurement) and 2026 LinkedIn Ads Waste Report (56 accounts, $9.4M; 32% average; waste hides in targeting; ~33% reaches decision-makers; recovery to 11.8%).
- Marqeable (broad match + smart bidding hides waste; Search 553% vs PMax 436% ROAS); FL0 (waste is scale-dependent; benchmark your own); Dreamdata 2026 (cross-channel ROAS context).
- Companion: The 30-Minute Cross-Platform Waste Diagnosis; Eliminate Junk Leads (the conversion-signal system).
This guide is educational, not investment or financial advice; waste benchmarks are agency-composite and scale-dependent, so treat them as directional and validate against your own accounts.
Related guides: The 30-Minute Cross-Platform Waste Diagnosis for B2B SaaS · $11.3M Google Ads Waste Report (43 B2B SaaS Accounts) · 2026 B2B SaaS LinkedIn Ads Waste Report · Clicks But No Demos: 7 Reasons B2B SaaS Google Ads Don’t Convert · Google Ads Benchmarks by Campaign Type: Brand vs Competitor vs Category.