ChatGPT
 Gemini
 Claude
 Perplexity
 DeepSeek
 Grok
Grok
Pipeline Velocity for B2B SaaS: The Metric That Ties Volume, Win Rate, Deal Size & Cycle Together (2026)
Quick answer: Pipeline velocity is the single number that ties your four core growth levers together — it multiplies your number of qualified opportunities, your win rate, and your average deal value, then divides by your sales cycle length, giving revenue generated per day. In 2026, B2B SaaS pipeline velocity varies enormously by segment — one large cross-company dataset (939 B2B companies) puts the average near $8,219/day, while a SaaS median lands closer to $1,847/day — so the real benchmark is your own trend, not a universal number, paired with win rates that have fallen to ~19% (from ~29% a year earlier) and cycles that vary from days (sub-$2K ACV) to 9 months (enterprise). Its power is that it exposes the levers most teams ignore: marketing obsesses over generating more opportunities (one of four inputs), while win rate, deal size, and — most overlooked — shortening the sales cycle move velocity just as much, often more cheaply. And because paid media influences all four levers, pipeline velocity is the metric that shows what your paid program is really doing to revenue, not just to lead volume.
Key takeaways
- Pipeline velocity = (# opportunities × win rate × deal value) ÷ cycle length = revenue/day.
- 2026 B2B SaaS velocity ≈ $743–$2,456/day with healthy cycles of 46–75 days.
- Four levers, not one: volume, win rate, deal size, and cycle length all move it.
- Shortening the cycle is as powerful as winning more — and often cheaper.
- Paid influences all four levers — so velocity shows paid’s real revenue impact.
Most B2B SaaS marketing is measured on a single lever: how many opportunities (or leads) it generated. But opportunities are only one of four inputs that determine how fast you actually make money — and optimizing volume alone leaves the other three on the table. Pipeline velocity is the metric that ties all four together into one number: revenue per day. This is what it is, the 2026 benchmarks, the four levers, and — the part that matters for paid — how advertising moves each one. (This is distinct from cost per opportunity and pipe-to-spend, which measure efficiency of spend; velocity measures speed of revenue.)
What is pipeline velocity?
Pipeline velocity measures how quickly opportunities move through your pipeline and turn into revenue — expressed as dollars per day. The standard formula:
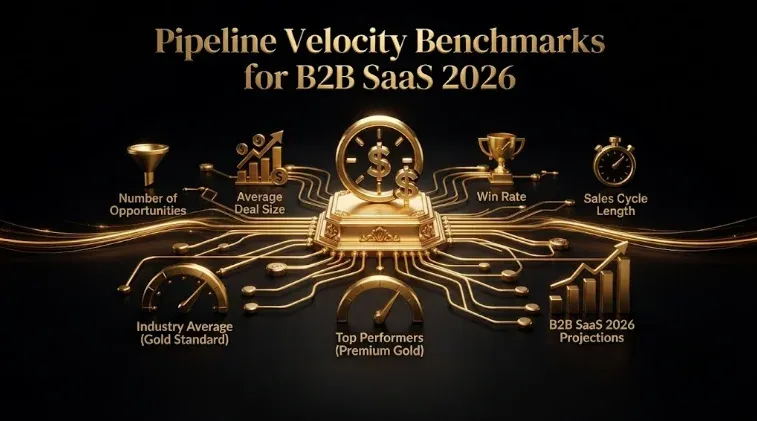
Pipeline velocity = (Number of qualified opportunities × Win rate × Average deal value) ÷ Sales cycle length (days)
The result is revenue generated per day. Increase any of the three numerator inputs (more opportunities, higher win rate, bigger deals) and velocity rises; shorten the denominator (faster sales cycle) and it rises too. That’s the whole point of the metric: it forces you to see revenue as the product of four levers, not one. A team that doubles its opportunity count but has a win rate that halves and a cycle that lengthens hasn’t improved velocity at all — a truth that “we generated more MQLs!” completely hides. Pipeline velocity is the closest single number to “how fast is our go-to-market actually producing revenue,” which is why it belongs on the leadership dashboard alongside pipe-to-spend and CAC payback — and why it’s a better north star than raw lead or opportunity volume.
What are the 2026 pipeline velocity benchmarks?
Directional 2026 B2B SaaS figures (they vary enormously by ACV and motion, so treat them as reference points, not targets):
| Input | Typical 2026 B2B SaaS range |
|---|---|
| Pipeline velocity (output) | ~$1,847/day (SaaS median) to ~$8,219/day (939-company avg); huge spread by segment |
| Win rate (opp → closed-won) | ~19% average (down from ~29%); 35–45% under $50K, 15–25% above $100K |
| Sales cycle length | ~46–75 days (healthy); longer for enterprise |
| Pipeline coverage | ~3–5x (SMB), higher for enterprise |
| Pipe-to-bookings ratio | ~20–35% |
The velocity output range is wide because the inputs vary so much — a self-serve product with a $5K ACV and a 20-day cycle and an enterprise product with a $150K ACV and a 9-month cycle can have wildly different velocities and both be healthy for their model. So the number to benchmark isn’t the industry average; it’s your own velocity trend over time and how each lever is moving. The single most useful thing about the benchmarks is what they reveal when you plug in your numbers: most teams discover their cycle length and win rate are dragging velocity far more than their opportunity count — the lever they’ve been pouring budget into. Benchmark your own velocity quarterly and watch which of the four inputs is actually constraining it.
The four levers — and why three are underused
Because velocity multiplies four inputs, there are four ways to increase it — but most B2B SaaS teams work only the first:
- More qualified opportunities (volume). The lever everyone optimizes — generate more pipeline. Real, but subject to diminishing returns and rising cost, and useless if the other three levers are weak.
- Higher win rate (quality). Improving opportunity quality (better fit, better qualification) lifts win rate, which multiplies velocity just as directly as more volume — often more cheaply, since it’s a conversion fix, not a media spend.
- Larger deal size (ACV). Targeting higher-ACV segments or expanding deal size raises velocity per opportunity — a lever marketing rarely thinks of as “its job,” though targeting decisions directly affect it.
- Shorter sales cycle (speed). The most overlooked and often highest-leverage lever: because cycle length is the denominator, shortening it raises velocity as much as improving any numerator input — and it’s frequently cheaper to move than buying more opportunities.
The strategic insight is that three of the four levers are chronically underused because marketing is measured on the first (volume) — but the deeper, more important truth is that the four levers are not independent; they interact, and the formula reveals the trade-offs. Three interactions matter most. First, bigger deals drag out the cycle — moving upmarket adds roughly 5–10 days of cycle per $10K of ACV, so doubling deal size often does little for velocity because the longer cycle cancels the gain (if your cycle is already 90+ days, moving upmarket can lower net velocity even as ACV rises). Second, shorter cycles win more — deals closing under ~50 days win around 47% versus ~20% for longer ones, so cutting the cycle lifts win rate too. Third, and most important, more volume past capacity backfires — pushing lead volume beyond what sales can work lowers win rate and lengthens cycles, so the one lever everyone pulls quietly damages two others. The practical upshot: lead quality is the highest-leverage input because it moves three of the four levers at once (better-fit opportunities raise win rate, shorten the cycle, and don’t bloat the pipeline). And the cleanest single lever is cycle length — a 15% cycle reduction produces the same velocity gain as a 15% ACV increase with no market repositioning, which is why cycle reduction offers the highest ROI at Series A/B. Pipeline velocity reframes the growth question from “how do we get more opportunities?” to “which lever buys the most speed for the least effort, given how they trade off?” — a far more productive question than the volume reflex.
Why is shortening the sales cycle the most overlooked lever?
Because cycle length sits in the denominator, so cutting it raises velocity across your entire pipeline at once — yet almost nobody treats it as a marketing lever. Halve your sales cycle and you double your velocity, with no increase in opportunities, win rate, or deal size. And the counterintuitive part for B2B SaaS: marketing and paid can shorten the cycle. Buyers who arrive better-educated (through content, thought-leadership, and demand-creation advertising) move through evaluation faster — some analyses show better-informed buyers arrive later but progress through MQL-to-SQL and SQL-to-close faster once in pipeline. So a paid program that educates buyers before they enter the funnel isn’t just filling the top; it’s speeding the middle. Speed-to-lead compounds this: contacting a web lead within minutes rather than hours dramatically raises the odds of qualification, compressing the earliest stage. Most teams never connect their marketing to cycle length at all — they measure marketing on volume and treat cycle length as a sales problem. Pipeline velocity makes the connection visible, and shortening the cycle is often the fastest, cheapest way to raise it.
How does paid media move each velocity lever?
This is why pipeline velocity matters for a paid program specifically: paid influences all four levers, so velocity is the truest measure of paid’s revenue impact — far better than lead volume.
- Volume: paid generates opportunities — the lever it’s usually measured on, and the one most subject to diminishing returns.
- Win rate: paid’s targeting and lead quality directly affect win rate — better-fit clicks (via filtering creative and qualified-signal optimization) produce opportunities that win more often.
- Deal size: paid’s targeting (which ACV segments, which channels — LinkedIn skews to larger deals) shapes average deal value.
- Cycle length: paid’s demand-creation and education shorten the cycle by producing better-informed buyers who move faster.
The implication: judging paid on opportunity volume alone measures one of four levers it’s affecting. A paid program that generates slightly fewer but far better-fit opportunities (higher win rate), in higher-ACV segments (bigger deals), from better-educated buyers (shorter cycle) can raise pipeline velocity dramatically while lowering lead volume — and look like it’s underperforming on a lead-count dashboard. Pipeline velocity is the metric that reveals this, which is why it’s the right way to judge whether paid is actually accelerating revenue or just manufacturing leads.
Field note: The most clarifying thing a B2B SaaS team can do is write out the pipeline velocity formula and ask, for each of the four levers, “when did we last try to move this one?” For most teams the honest answer is that they’ve spent years hammering the first lever — more opportunities, more MQLs, more volume — and have essentially never run a deliberate program to raise win rate, increase deal size, or shorten the cycle. Which is strange, because the math treats all four equally: a 20% gain in any one of them moves velocity by the same amount, and three of them are usually cheaper to improve than buying 20% more opportunities in an auction that gets more expensive every quarter. The sleeper lever is cycle length, because it’s in the denominator and because almost nobody thinks of it as a marketing responsibility — yet demand-creation advertising and better buyer education demonstrably speed buyers through the middle of the funnel, and shaving weeks off the cycle raises velocity across every deal at once. If your growth plan for next quarter is entirely “generate more pipeline,” you’re optimizing one of four levers and ignoring the three that might be cheaper. Run the formula, find your weakest lever, and work that one — velocity, not volume, is what actually pays the bills.
Honest limitations
- These are directional ranges. Velocity varies enormously by ACV and motion; benchmark your own trend, not the industry average.
- It’s only as honest as your definitions. “Qualified opportunity,” win rate, and cycle length must be defined consistently or the number misleads.
- Averages hide segment differences. Blended velocity across very different deal sizes and cycles can obscure more than it reveals; segment where possible.
- Cycle length has a floor. You can’t shorten a considered B2B decision indefinitely; there’s a natural minimum below which pushing harms the deal.
- Educational, not investment or financial advice — validate against your own data.
Frequently Asked Questions
Q1. What is pipeline velocity for B2B SaaS?
Pipeline velocity measures how quickly opportunities turn into revenue, expressed as dollars per day. The formula is (number of qualified opportunities × win rate × average deal value) ÷ sales cycle length in days. It ties your four core growth levers into one number: increase opportunities, win rate, or deal value, or shorten the cycle, and velocity rises. It’s the closest single metric to “how fast is our go-to-market producing revenue,” which makes it a better north star than raw lead or opportunity volume.
Q2. What’s a good pipeline velocity in 2026?
Directionally, B2B SaaS pipeline velocity runs around $743–$2,456 per day in 2026, paired with healthy sales cycles of ~46–75 days, win rates near 19–21% (top performers 30%+), and 3–5x pipeline coverage. But the range is wide because the inputs vary enormously by ACV and motion — a $5K-ACV self-serve product and a $150K-ACV enterprise product can have very different velocities and both be healthy. Benchmark your own velocity trend over time and which lever is constraining it, not the industry average.
Q3. How do you calculate pipeline velocity?
Multiply three numerator inputs — number of qualified opportunities, win rate, and average deal value — then divide by sales cycle length in days. For example, 50 opportunities × 20% win rate × $30,000 deal value ÷ 60 days = $5,000 per day. Increasing any numerator input or shortening the cycle raises velocity. The formula’s value is that it forces you to see revenue as the product of four levers, not one — so “we generated more MQLs” means nothing if win rate fell or the cycle lengthened.
Q4. What are the four levers of pipeline velocity?
More qualified opportunities (volume — the lever most teams over-optimize), higher win rate (quality — better fit and qualification), larger deal size (ACV — targeting higher-value segments), and shorter sales cycle (speed — the denominator). A 20% improvement in any one moves velocity equally, yet most B2B SaaS teams work only the first. Three of the four (win rate, deal size, cycle length) are chronically underused and often cheaper to move than buying 20% more opportunities.
Q5. Why is shortening the sales cycle so powerful?
Because cycle length is the denominator, so cutting it raises velocity across your entire pipeline at once — halving the cycle doubles velocity with no increase in opportunities, win rate, or deal size. It’s the most overlooked lever because almost nobody treats it as a marketing responsibility. Yet marketing can shorten it: better-educated buyers (from content and demand-creation advertising) move through evaluation faster, and fast speed-to-lead compresses the earliest stage. It’s often the fastest, cheapest way to raise velocity.
Q6. How does paid media affect pipeline velocity?
Paid influences all four levers: it generates opportunities (volume), its targeting and lead quality affect win rate (better-fit clicks win more often), its targeting shapes deal size (which ACV segments and channels — LinkedIn skews larger), and its demand-creation and education shorten the cycle (better-informed buyers move faster). This is why judging paid on opportunity volume alone measures just one of four levers it’s affecting — a paid program producing fewer but better-fit, higher-ACV, better-educated opportunities can raise velocity while lowering lead volume.
Q7. How is pipeline velocity different from pipe-to-spend or cost per opportunity?
Pipe-to-spend and cost per opportunity measure the efficiency of your spend (how much pipeline or how many opportunities per dollar). Pipeline velocity measures the speed of revenue (how fast opportunities turn into money, in dollars per day). They’re complementary: efficiency metrics tell you whether you’re spending well; velocity tells you how fast the resulting pipeline converts to revenue. A program can be efficient (good pipe-to-spend) but slow (low velocity) if win rates are low or cycles are long — velocity catches what efficiency metrics miss.
Sources & further reading
- SaaSHero 2026 (pipeline velocity $743–$2,456/day; ideal 46–75 day cycles; weighted pipeline; 3–5x coverage); Ebsta × Pavilion GTM Benchmarks (win rates ~19–21%).
- First Page Sage / industry (better-informed buyers progress faster once in pipeline); MIT/InsideSales (speed-to-lead compresses early-stage conversion).
- Companion: Cost per Opportunity & Pipeline-per-Dollar Benchmarks (efficiency of spend); The Long-Sales-Cycle Paid Media Playbook (cycle length).
This guide is educational, not investment or financial advice; velocity varies enormously by ACV and motion and depends on consistent definitions, so benchmark your own trend and validate against your own data.
Related guides: Cost per Opportunity & Pipeline-per-Dollar Benchmarks · The Long-Sales-Cycle Paid Media Playbook · B2B SaaS Paid Ads Ramp-Up Benchmarks: Time-to-Pipeline · The B2B SaaS Paid Funnel Math: Click to Closed-Won · Marketing-Sourced vs Influenced Pipeline Benchmarks.