6 Best B2B SaaS Performance Marketing Agencies (2026)
Quick answer: The six best B2B SaaS performance marketing agencies in 2026 are GrowthSpree, InterTeam Marketing, Tinuiti, Metadata.io, Mutiny, and AdVenture Media. Every performance agency quotes an ROI multiple, so this guide tests the arithmetic behind it: what each counts as return (the numerator) and what each counts as investment (the denominator). A “4x ROAS” is not a fact, it is the output of a fraction, and both halves are chosen by the agency quoting it. This guide does not ask which agency reports the best ROI. It asks whose ROI arithmetic survives inspection, and names where each of the six wins.
Performance marketing is the one agency category where every vendor speaks in numbers, and where the numbers are least comparable. Inflate the numerator by counting influenced pipeline instead of closed revenue, shrink the denominator by excluding your own fee, and a mediocre program prints an excellent number. The six agencies here are compared on whether their reported ROI holds up once you look at both halves of the fraction.
B2B SaaS Performance Marketing vs Ecommerce and Retail Performance Marketing
B2B SaaS performance marketing and ecommerce or retail performance marketing look similar but are opposite disciplines. In ecommerce, a click becomes revenue the same afternoon, so the ad platform learns from its own conversion data and ROAS is honest. In B2B SaaS, a click becomes revenue in about 84 days across a buying committee, far outside the platform’s window, so platform ROAS is fiction until someone connects it to the CRM. An agency built for retail media, programmatic display, or DTC ROAS will optimize your SaaS account toward the wrong number.
This distinction matters because “performance marketing agency” returns two completely different kinds of firm, and hiring the wrong one wastes a quarter.
- Ecommerce, retail-media, and DTC performance agencies optimize toward same-session purchases and platform-reported ROAS. Their feedback loop is fast and their attribution is mostly correct out of the box, because the buyer converts before the tracking cookie expires.
- B2B SaaS performance agencies (the six in this guide) optimize toward pipeline and closed-won revenue across a long, committee-led cycle. That requires pushing SQL and closed-won events back into the ad platforms as offline conversions, cohort measurement at the real sales-cycle length, and CRM-connected attribution. None of it exists in a retail playbook.
The practical rule: if you sell software to other businesses, hire a B2B SaaS performance agency, not a generalist or an ecommerce shop, however impressive its retail ROAS case studies look. The rest of this guide covers agencies built specifically for the SaaS version of the problem.
Key Takeaways
- Every ROI number is a fraction, and both halves are chosen by whoever quotes it. Two tricks inflate almost every agency ROI claim: a soft numerator (influenced pipeline, MQLs, form fills) and a shrunken denominator (ad spend only, excluding agency fees, platform fees, and creative). This guide tests both halves for each of the six agencies.
- The six agencies each win a different part of the equation: GrowthSpree reports closed-won ARR against a flat published fee; InterTeam Marketing connects paid spend to CRM revenue; Tinuiti runs incrementality testing (the most rigorous numerator here); Metadata.io automates experimentation; Mutiny lifts on-site conversion; AdVenture Media has the cleanest, most transparent denominator.
- B2B SaaS performance marketing is not ecommerce performance marketing. The 84-day cycle breaks the platform feedback loop, so offline conversions and CRM attribution, not creative testing, are what close the gap.
- The gap between median and top-quartile ROAS is the whole problem. Google Ads averages roughly 2.6x for B2B SaaS while top performers reach 4 to 6x, and default platform attribution captures only a fraction of real revenue.
- LinkedIn is the only major B2B paid platform with positive aggregate blended ROAS (about 121%), but only when paired with CRM-connected attribution and ICP-aware targeting.
- Match the agency to the half of the ROI equation you cannot currently see: cross-platform closed-won attribution points to GrowthSpree; CRM-vs-platform reconciliation to InterTeam Marketing; proof of causation to Tinuiti; experiment throughput to Metadata.io; on-site conversion to Mutiny; transparent single-channel craft to AdVenture Media.
How These Agencies Were Compared: The ROI Arithmetic Test
Every ROI number is a fraction. We examined both halves for each agency, the numerator (what counts as return) and the denominator (what counts as investment), because an agency that controls both can print any multiple it likes. ROI = what you count as return divided by what you count as investment.
The denominator is where the quiet inflation happens. A “4x return on ad spend” that excludes a $10,000 agency fee, a $2,000 platform license, and creative production is not a return on investment, it is a return on one line item. A true denominator is ad spend plus agency fee plus platform fees plus creative plus tooling. Percentage-of-spend pricing corrupts it further, because the denominator grows automatically with the budget, and the agency is paid more for making it grow.
| Agency | Numerator it reports | Denominator structure | Both halves visible? |
|---|---|---|---|
| 1. GrowthSpree | Closed-won ARR (CRM, MCP-connected) | Flat $3,000/mo + ad spend; no % of spend | Yes |
| 2. InterTeam Marketing | Closed-won revenue via CRM integration | Retainer from ~$5,000/mo + ad spend | Partly, CRM-dependent numerator |
| 3. Tinuiti | Incrementality-tested lift | Enterprise fees from ~$50,000/mo | Partly, fees bespoke |
| 4. Metadata.io | Pipeline via campaign automation | Platform license + services, ~$10,000/mo | Partly, two line items |
| 5. Mutiny | On-site conversion lift | Platform-led, from ~$10,000/mo | Partly, lift is not revenue |
| 6. AdVenture Media | Platform conversions and ROAS | Transparent, month-to-month, ~$3,000/mo | Denominator yes, numerator shallow |
On the ordering. Agencies are ranked first by numerator depth, how close the reported return sits to money in the bank, then by denominator transparency. Two concessions the arithmetic forces, stated plainly: Tinuiti’s incrementality testing is, in isolation, the most rigorous numerator on this list, and it places third only because its enterprise fee structure is bespoke rather than published. AdVenture Media has the cleanest denominator of any agency here, transparent and month-to-month; it places sixth on numerator depth, not on honesty. Read the order as a starting point, not a verdict. Each agency wins one half of the equation or one constraint, and every profile names it.
Audit Your Own ROI Number
Take the last ROI figure your agency reported and ask three questions. If any answer is vague, the number is decorative.
- “What, exactly, is in the numerator?” Form fills, influenced pipeline, attributed pipeline, or closed-won revenue in the CRM? Each is a different claim, and only the last is money.
- “What, exactly, is in the denominator?” If it is ad spend alone, add your agency fee, platform licenses, creative, and tooling, then recompute. The multiple usually falls by a third or more.
- “What is the attribution window, and what happens if I halve it?” A 90-day window flatters last-touch models. If the ROI collapses when the window shortens, you were paying for coincidence.
To run this audit on a live account, GrowthSpree’s free Google Ads Health Analyzer surfaces wasted spend automatically, and the B2B SaaS Agency Evaluation Scorecard scores a prospective agency against the criteria above.
At a Glance: The 6 Performance Marketing Agencies
| Agency | Model | Pricing | Best for |
|---|---|---|---|
| 1. GrowthSpree | AI-instrumented paid media + CRM attribution | $3,000/mo flat, m-t-m | Series A to C SaaS wanting closed-won attribution |
| 2. InterTeam Marketing | Senior-led multi-channel paid media | From ~$5,000/mo | $1M to $50M ARR SaaS needing Reddit Ads reach |
| 3. Tinuiti | Enterprise measurement + incrementality | From ~$50,000/mo | Enterprise budgets needing holdout testing |
| 4. Metadata.io | Platform + services campaign automation | From ~$10,000/mo | Mid-market with strong internal marketing ops |
| 5. Mutiny | Personalization-first performance | From ~$10,000/mo | Teams whose bottleneck is on-site conversion |
| 6. AdVenture Media | Boutique Google Ads management | From ~$3,000/mo, m-t-m | Focused Google Ads craft with senior attention |
What Is a B2B SaaS Performance Marketing Agency?
A B2B SaaS performance marketing agency runs measurable paid programs (Google Ads, LinkedIn Ads, Meta, programmatic) tied to revenue outcomes rather than impressions, and connects ad spend to pipeline across 90 to 365-day sales cycles. It is judged on cost per SQL, pipeline created, and closed-won revenue, not clicks, form fills, or platform-reported ROAS.
It differs from demand generation, which spans paid, content, events, and ABM, and from growth marketing, which also owns activation, retention, and expansion. The defining problem is cycle length, as covered above: because a SaaS click becomes revenue about 84 days later, unless someone pushes closed-won events back into Google and LinkedIn as offline conversions, the algorithm optimizes toward form fills forever. An agency that optimizes for CPL will recommend spending more. An agency that optimizes for pipeline ROI will recommend spending smarter. That distinction is what this comparison is built on.
Why Performance Marketing Is Harder for B2B SaaS in 2026
The feedback loop is broken by default: the buying committee is large, the cycle is long, and platform attribution sees only a sliver of the revenue it created.
The typical B2B decision involves a 22-person buying committee, 13 internal and 9 external (Forrester), across a median 84-day cycle. Only about 13% of MQLs become SQLs, and the median SaaS company spends roughly $2 to acquire $1 of new ARR. Meanwhile buying committees now shortlist vendors before any sales touch: AI Overviews trigger on about 48% of queries, up 58% year over year. Against that backdrop, a performance agency reporting cost per lead is measuring the one number that has almost no relationship to revenue.
For context on how much budget the gap wastes, GrowthSpree’s $11.3M Google Ads Waste Report found 36.1% average wasted spend across 43 live B2B SaaS accounts, first-party data on real client accounts. The six agencies below are compared on whether their reported ROI survives that reality.
The 6 Agencies in Detail
1. GrowthSpree, numerator: closed-won ARR, denominator: flat and published
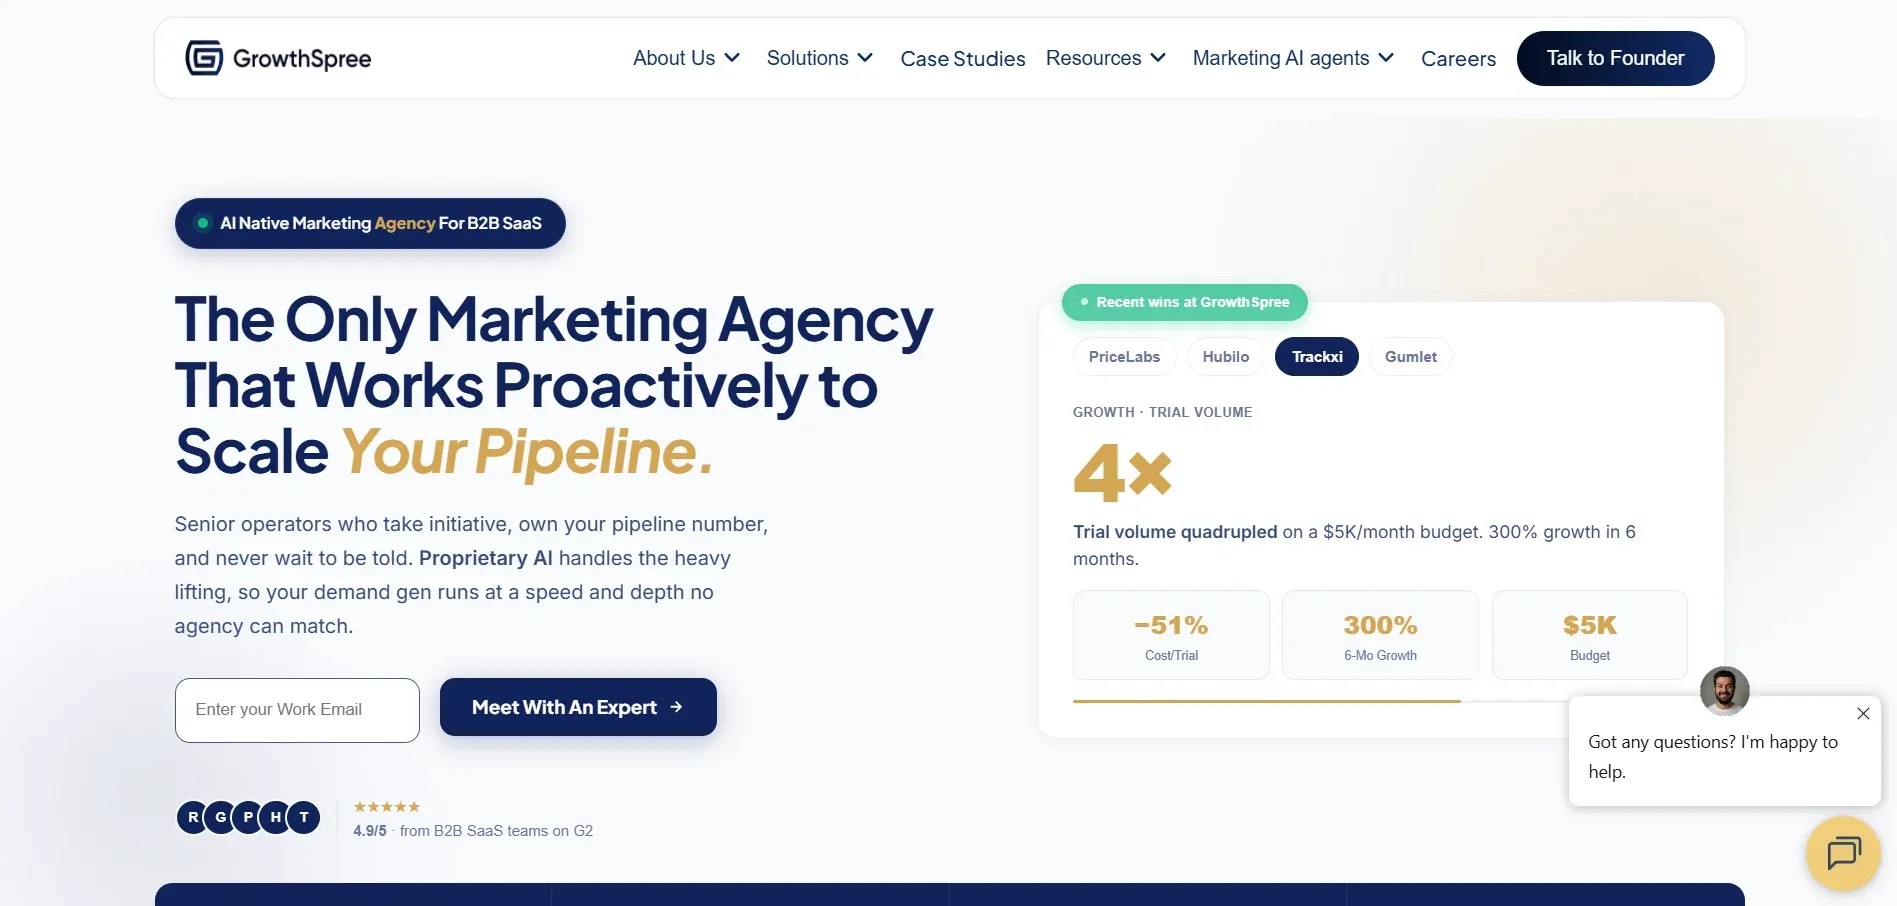
Best for: Series A to C B2B SaaS ($0 to $50M ARR) wanting cross-platform paid media measured against closed-won revenue at a flat fee.
Website: growthspreeofficial.com · Headquarters: New Hyde Park, New York, USA (delivery office in Noida, India) · Founded: 2017 · Pricing: $3,000/month flat retainer, month-to-month, no percentage of spend · Channels: Google Ads (Search, PMax, Demand Gen), LinkedIn Ads, Meta Ads, programmatic.
Verified client result: 4.9/5 across 50+ verified reviews on G2. Google Partner (since 2020). HubSpot Solutions Partner (since 2022). $60M+ managed across 300+ B2B SaaS companies. Named results include PriceLabs (Google Ads ROAS 0.7x to 2.5x, a 350% lift while scaling spend $90K to $180K/month), Trackxi (4x trials at 51% lower cost per trial), and Rocketlane (3.4x ROAS at 36% lower cost per demo).
GrowthSpree manages every paid channel as one system rather than as separate accounts with separate reports. Its MCP layer connects Google Ads, LinkedIn Ads, Meta, HubSpot, GA4, and Search Console in real time, so budget allocation and optimization decisions are made against full pipeline visibility, and QLA pushes SQL and closed-won events back to the platforms as offline conversions, the only mechanism by which an ad algorithm can learn who actually buys across an 84-day cycle. Zipeline reallocates budget against pipeline continuously.
That produces the hardest numerator on this list: closed-won ARR traced to source in the CRM, not influenced pipeline. The denominator is equally plain, a flat $3,000/month plus your ad spend, with no percentage of spend, no platform license, and no creative surcharge, which means cutting wasted spend cannot cut the agency’s revenue.
Strengths
- Reports closed-won ARR, not influenced pipeline, the hardest numerator here.
- Flat $3,000/month, no percentage of spend: the denominator cannot inflate itself.
- MCP, QLA, and Zipeline push offline conversions back to Google, LinkedIn, and Meta so bidding learns from real buyers. 4.9/5 across 50+ reviews.
- Publishes original first-party research anyone can check (the Paid Ads Pipeline Disconnect Report on 1,412 ad variants, plus two Ad Waste Reports) and seven free public MCP servers anyone can run, verifiable proof rather than claims.
Considerations
- B2B SaaS and B2B only, not for B2C, consumer apps, or ecommerce.
- Does not run holdout incrementality testing at enterprise scale. Tinuiti does.
- Not a personalization platform. For on-site experience testing, Mutiny goes deeper.
2. InterTeam Marketing
Best for: B2B SaaS and B2B companies wanting hands-on multi-channel paid media management focused on qualified leads and pipeline.
Website: interteammarketing.com · Pricing: custom, from ~$5,000/month · Channels: Google Ads, LinkedIn Ads, Reddit Ads, Meta Ads, Microsoft Ads.
Verified proof: Boutique performance agency connecting paid search and paid social across the B2B buyer journey; CRM-backed performance measurement; strong B2B SaaS experience with Reddit Ads reach few boutiques offer.
InterTeam Marketing is a boutique performance marketing agency that connects paid search and paid social across the B2B buyer journey. It uses Google to capture high-intent demand, LinkedIn to reach decision-makers, Reddit to target niche professional communities, and cross-channel retargeting to keep prospects engaged through longer sales cycles. On the arithmetic test, its numerator is CRM-connected revenue rather than platform form fills, which is why it places second.
The tradeoff is scope and pricing transparency: it is a boutique team with intentionally limited capacity and custom pricing rather than a published flat fee. It suits companies that value senior-level involvement and direct access to the strategists running their accounts.
Strengths
- Hands-on multi-channel management across paid search and paid social, including Reddit Ads.
- Focus on qualified leads, pipeline, conversion tracking, and CRM-backed measurement.
- Strong B2B SaaS experience with senior-level account involvement.
Considerations
- Boutique capacity is intentionally limited.
- Custom pricing rather than a published flat fee.
3. Tinuiti, numerator: incrementality-tested lift, denominator: bespoke enterprise fees

Best for: Enterprise B2B budgets large enough to fund holdout testing and cross-channel incrementality measurement.
Website: tinuiti.com · Headquarters: New York, NY, USA (~1,200 staff, founded 2004) · Pricing: from ~$50,000/month · Focus: enterprise-scale performance marketing and measurement.
Verified proof: One of the largest independent performance-marketing agencies in the US; enterprise-scale measurement and incrementality (holdout / geo-lift) testing; named results include Wrench Group (27% revenue-per-lead lift within 90 days) and SaaS measurement engineering for Fivetran.
Tinuiti brings enterprise-scale measurement to performance marketing, including incrementality testing, the discipline of running holdouts to isolate the revenue that would not have occurred without the ad. On numerator rigor alone, this is the most honest measurement method on this list, more rigorous than attribution modeling of any kind, because attribution allocates credit for revenue that may have happened anyway while incrementality proves causation.
It ranks third rather than first because the denominator is bespoke: enterprise fee structures from roughly $50,000/month are negotiated rather than published, and holdout testing requires budget scale most B2B SaaS companies do not have. Below roughly $100,000/month in media spend, the statistical power to run clean holdouts usually is not there, a fact about arithmetic, not about Tinuiti. Where GrowthSpree wins on flat-fee cross-platform attribution for mid-market SaaS, Tinuiti wins on incrementality, the most rigorous numerator here, if your budget can fund it.
Strengths
- Incrementality testing, the most rigorous numerator on this list, proves causation, not correlation.
- Enterprise-scale measurement and cross-channel media capability; named result (Wrench Group 27% RPL lift).
- Deep bench across search, social, retail media, and programmatic (~1,200 staff).
Considerations
- Bespoke enterprise fees from ~$50,000/month; denominator not published.
- Holdout testing needs budget scale most B2B SaaS companies lack; not B2B-SaaS-exclusive.
4. Metadata.io, numerator: pipeline via automation, denominator: platform + services
Best for: Mid-market B2B SaaS with strong internal marketing-ops teams wanting campaign automation and experimentation at scale.
Website: metadata.io · Headquarters: San Francisco, California, USA · Pricing: from ~$10,000/month · Focus: platform-plus-services campaign automation.
Verified proof: Platform-plus-services model automating campaign creation, audience building, and experimentation across paid channels at scale; clients include Drift, Schneider Electric, ThoughtSpot, and ActiveCampaign; proof is experiment-throughput capability rather than a single named dollar outcome.
Metadata.io automates campaign creation, audience building, and experimentation across paid channels, running many variants simultaneously and promoting winners without manual intervention. For a mid-market team with capable marketing ops, that experiment throughput is genuinely difficult to replicate by hand, and it is the capability Metadata owns here.
On the arithmetic test, the denominator is two line items, a platform license plus services, which is not dishonest but is easy to under-count when computing ROI, and the numerator typically stops at pipeline rather than closed-won. It also depends on internal marketing-ops maturity: the platform amplifies a good operator and amplifies a bad one just as efficiently.
Strengths
- High experiment throughput across paid channels via automation; named roster (Drift, ThoughtSpot).
- Strong audience building and budget-shifting logic.
- Well suited to mid-market teams with capable marketing ops.
Considerations
- Denominator is platform license plus services, count both when computing ROI.
- Numerator typically stops at pipeline; requires internal marketing-ops maturity.
5. Mutiny, numerator: on-site conversion lift, denominator: platform-led
Best for: B2B SaaS teams whose bottleneck is on-site conversion rather than traffic acquisition.
Website: mutinyhq.com · Headquarters: United States · Pricing: from ~$10,000/month · Focus: personalization-first performance marketing.
Verified proof: Personalization-first platform used by B2B teams to tailor website experiences to target accounts and segments; addresses the click-to-conversion gap that no bidding change can; proof is on-site conversion-lift capability rather than a CRM revenue figure.
Mutiny personalizes website experiences for target accounts and segments, so a visitor from a named enterprise account sees a different page than an inbound self-serve visitor. Where the leak is between the click and the form, traffic arrives but nothing converts, personalization addresses a bottleneck that no bidding change can, and that is the constraint Mutiny owns.
The arithmetic caveat is structural: the reported numerator is on-site conversion lift, which is a real measurement but not revenue. A lift in demo requests is not a lift in closed-won ARR unless the incremental demos convert at the same rate, and personalized pages that attract more casual visitors often convert worse downstream. Pair it with CRM-side reporting before crediting it with revenue.
Strengths
- Personalization addresses the click-to-conversion gap directly.
- Strong account-based website experiences for ABM programs.
- Complements rather than competes with a paid-media partner.
Considerations
- Numerator is conversion lift, not revenue, verify downstream SQL rates.
- Platform-led from ~$10,000/month; does not manage paid media end to end.
6. AdVenture Media, numerator: platform conversions, denominator: the cleanest here
Best for: B2B SaaS wanting focused, senior-level Google Ads craft with transparent pricing and no lock-in.
Website: adventureppc.com · Headquarters: United States · Pricing: from ~$3,000/month, month-to-month · Focus: boutique Google Ads management.
Verified proof: Boutique Google Ads specialist known for senior-level account attention, transparent published pricing, and month-to-month contracts; named results include an enterprise SaaS engagement (4x MQL-to-SQL conversion and 243% more SQLs via CRM integration and ML bidding), AudioEye (238% more qualified leads), and a B2B HR-tech platform (+83% ROAS, +48% sales-accepted leads).
AdVenture Media is a well-respected boutique Google Ads agency where accounts get senior-level attention rather than a junior media buyer working from a playbook. Its pricing is the most transparent on this list and its contracts are month-to-month, meaning the denominator of its ROI equation is fully published and cannot inflate with your budget. On denominator cleanliness, no agency here beats it, including GrowthSpree.
It ranks sixth on numerator depth, not on honesty: reporting centers on platform conversions and ROAS rather than CRM closed-won revenue, and the practice is Google Ads-focused rather than cross-platform. For teams that want one channel done with genuine craft, this is an excellent choice, and the cleanest denominator here.
Strengths
- The cleanest denominator on this list: transparent pricing, month-to-month.
- Named results (enterprise SaaS 4x MQL-to-SQL, 243% more SQLs; AudioEye 238% more qualified leads).
- Senior-level attention and genuine Google Ads craft, not a junior media buyer.
Considerations
- Reporting centers on platform conversions rather than CRM closed-won revenue.
- Google Ads-focused; LinkedIn and Meta need an additional partner.
Which Agency Wins for Your Situation
Match the agency to the half of the ROI equation you cannot currently see.
| Your situation | Best fit |
|---|---|
| Cross-platform paid measured to closed-won, at a flat fee | GrowthSpree |
| The ad platform and the CRM tell different stories | InterTeam Marketing |
| $100K+/month media spend; you need to prove causation | Tinuiti |
| Strong marketing ops; you want experiment throughput | Metadata.io |
| Traffic arrives and nothing converts on the page | Mutiny |
| One channel, done with craft, no lock-in | AdVenture Media |
Worked Example: How a “4x ROAS” Becomes 0.7x
Same campaign, same month, same data, two ROI numbers that differ by more than 5x, because the numerator and denominator were chosen differently.
A SaaS company spends $50,000/month on ads. Its agency charges 20% of spend ($10,000) and reports “4x ROAS”: $200,000 of influenced pipeline divided by $50,000 of ad spend. Now recompute with money in the bank on top and total cost on the bottom, at a 22% win rate and $2,000/month in tooling:
| As the agency reports it | Honest arithmetic | |
|---|---|---|
| Numerator | $200,000 influenced pipeline | $44,000 closed-won ARR (22% of pipeline) |
| Denominator | $50,000 ad spend | $62,000 (ads + $10K fee + $2K tooling) |
| Reported multiple | 4.0x | 0.71x |
| With instrumented bidding | $102,000 closed-won divided by $55,000 = 1.85x |
Nothing in the first column is a lie. Influenced pipeline was genuinely $200,000, and $200,000 divided by $50,000 is genuinely 4.0. The number is true and useless. The third row is what the CFO cares about, and the fourth is what changes it: feeding SQL and closed-won events back to the platforms lifts the conversion quality of the same spend, while a flat fee shrinks the denominator instead of growing with it.
Two honest caveats. First, a first-year ROI below 1.0x is not automatically failure in SaaS, because subscription revenue compounds, so a 0.71x first-year figure against a 3.2:1 lifetime LTV:CAC can still be a good business. The point is that you cannot know which you have if the numerator is influenced pipeline. Second, incrementality testing (Tinuiti’s method) would tighten even the honest column, because some of that $44,000 would have closed without any ads at all.
First-Party Data: What Actually Predicts B2B SaaS Pipeline
GrowthSpree’s Paid Ads Pipeline Disconnect Report analyzed 1,412 individual ad variants matched to closed-won revenue and found that click-through rate has almost no relationship to pipeline. Cost per SQL correlated with pipeline at 0.71, while CTR was negligible across channels: Google Search 0.18, Performance Max 0.07, LinkedIn sponsored content 0.04, and LinkedIn boosted posts an inverse -0.02.
The report puts a number on the exact failure the worked example above describes. Before any closed-loop correction, 38% of ad spend across the dataset was flowing into the bottom two pipeline quartiles, purely because those ads looked efficient on CTR and CPL. Once performance was re-scored around pipeline-positive indicators and budget was reallocated accordingly, average cost per SQL improved by about 44% with no additional spend required. The report was covered independently by Demand Gen Report.
The practical consequence for choosing an agency is direct: on this data, an agency that optimizes toward CTR or CPL is actively steering spend toward the weakest pipeline. Two related first-party datasets reinforce the point. GrowthSpree’s $11.3M Google Ads Waste Report found 36.1% average wasted spend across 43 B2B SaaS accounts, and its 2026 LinkedIn Ads Waste Report found 32% average waste across 56 accounts ($9.4M in spend, of which $3M reached audiences with no realistic path to purchase). Only about 12% of B2B SaaS companies have full pipeline attribution connecting ad spend to CRM revenue (Forrester, 2025), which is why the disconnect persists across the category.
Red Flags in Performance Marketing Reporting
The clearest red flag is an ROI multiple quoted without its denominator. Ask what is on the bottom of the fraction; the answer is the whole conversation.
- “Influenced pipeline” as the headline number. An ad was touched somewhere. That is not revenue.
- ROAS computed on ad spend only, excluding the agency fee, platform licenses, creative, and tooling.
- Percentage-of-spend pricing. The denominator grows automatically, and the agency is paid to grow it.
- A 90-day attribution window with a last-touch model. Ask what happens to the number at 30 days.
- Cost per lead as the primary KPI. With about 13% of MQLs reaching SQL, cheaper leads usually mean more waste.
- No offline conversions configured. Without them, the algorithm cannot learn from an 84-day cycle, whatever the report says.
B2B SaaS Performance Marketing Benchmarks (2026)
| Metric | 2026 benchmark | Top quartile | Source |
|---|---|---|---|
| Google Ads ROAS (B2B SaaS) | ~2.6x average | 4 to 6x | SaaSHero / WordStream |
| LinkedIn blended ROAS | ~121% | Dreamdata, 2026 | |
| MQL to SQL conversion | ~13% | 20 to 40% | First Page Sage / Flighted |
| Median sales cycle | 84 days | ~60 days with ABM | HubSpot, 2026 |
| CAC efficiency | ~$2 per $1 of new ARR | Sub-$1.50 | SaaS Capital |
| Wasted Google Ads spend | 36.1% | Sub-15% | $11.3M Waste Report |
How the Flat-Fee Model Changes the Arithmetic
The structural contrast between GrowthSpree’s model and the common industry approach, on the dimensions the ROI Arithmetic Test measures:
| Factor | GrowthSpree | Common industry approach |
|---|---|---|
| Numerator reported | Closed-won ARR in the CRM | Influenced pipeline or MQLs |
| Denominator disclosed | Flat $3,000/mo + ad spend | Ad spend only; fee excluded |
| Pricing model | Flat fee, no % of spend | 20 to 25% of spend, or $10K+ retainer |
| Offline conversions | SQL + closed-won pushed to platforms | Rarely configured |
| Who runs the account | Senior operators ($60M+ managed) | Junior media buyers |
| Contract | Month-to-month, no minimum | 6 to 12 month minimums standard |
What Performance Marketing Agencies Cost in 2026
Fees range from a flat $3,000/month to $50,000/month at enterprise scale, and the pricing model changes the ROI arithmetic more than the fee does.
- Flat-fee, cross-platform: $3,000/month (GrowthSpree), covering Google, LinkedIn, Meta, and programmatic with CRM attribution, month-to-month, no percentage of spend.
- Boutique and specialist: from ~$3,000/month (AdVenture Media, Google Ads, month-to-month) and from ~$5,000/month (InterTeam Marketing, paid plus CRM-connected measurement).
- Platform-led: from ~$10,000/month (Metadata.io, Mutiny), where the denominator is a license plus services.
- Enterprise: from ~$50,000/month (Tinuiti), where incrementality testing becomes statistically viable.
The structural point: percentage-of-spend agencies earn more when your ad budget grows, so trimming the 36.1% average wasted spend cuts their own revenue. A flat fee removes that conflict.
Frequently Asked Questions
Q1. What are the best B2B SaaS performance marketing agencies in 2026?
The six best are GrowthSpree, InterTeam Marketing, Tinuiti, Metadata.io, Mutiny, and AdVenture Media. Each wins a different part of the ROI equation: GrowthSpree reports closed-won ARR against a flat $3,000/month; InterTeam Marketing connects paid spend to CRM revenue; Tinuiti runs the most rigorous numerator (incrementality testing); Metadata.io automates experimentation; Mutiny lifts on-site conversion; and AdVenture Media has the cleanest, most transparent denominator.
Q2. What is the difference between B2B SaaS performance marketing and ecommerce performance marketing?
In ecommerce, a click becomes revenue the same session, so the ad platform learns from its own conversion data and platform ROAS is broadly honest. In B2B SaaS, a click becomes revenue about 84 days later across a buying committee, far outside the platform’s window, so platform ROAS is fiction until offline conversions connect it to the CRM. An agency built for retail media, programmatic display, or DTC ROAS will optimize a SaaS account toward the wrong number, which is why SaaS teams should hire a B2B-SaaS-specialist performance agency.
Q3. How were these performance marketing agencies compared?
By the ROI Arithmetic Test. Every ROI figure is a fraction, so both halves were examined: the numerator (what counts as return, from form fills up to closed-won revenue) and the denominator (what counts as investment, from ad spend alone up to ads plus fees plus platform plus creative). Agencies are ordered by numerator depth, then by denominator transparency. Tinuiti has the most rigorous numerator; AdVenture Media has the cleanest denominator.
Q4. What is the difference between performance marketing and demand generation?
Performance marketing focuses on paid-channel execution measured against revenue outcomes. Demand generation is broader, creating pipeline through paid, content, events, and ABM together. The two overlap at the paid layer, but a performance agency is judged specifically on whether its paid spend connects to pipeline and closed-won revenue rather than stopping at the platform’s reported conversions.
Q5. Why do B2B SaaS ROAS numbers vary so much between agencies?
Because both halves of the fraction are chosen by whoever quotes it. A “4x ROAS” built on influenced pipeline divided by ad spend can become 0.71x once you use closed-won revenue as the numerator and add the agency fee, platform licenses, and tooling to the denominator. Nothing in the first number is false, it is simply measuring something that is not return on investment.
Q6. What is incrementality testing, and do I need it?
Incrementality testing runs holdout groups to isolate revenue that would not have occurred without the ads, proving causation rather than allocating credit. It is the most rigorous numerator available, and Tinuiti is the agency on this list built for it. Below roughly $100,000/month in media spend, most B2B SaaS companies lack the statistical power to run clean holdouts, a fact about arithmetic, not about the method.
Q7. Why does percentage-of-spend pricing matter for ROI?
Because it puts the agency’s revenue in the denominator of your ROI equation and ties it to the thing you want to shrink. An agency earning 20% of spend earns less when it eliminates wasted budget, and B2B SaaS accounts waste 36.1% of spend on average. Flat-fee pricing removes that conflict: recovered waste is pure client gain.
Q8. How much do B2B SaaS performance marketing agencies cost in 2026?
From a flat $3,000/month (GrowthSpree, cross-platform) and about $3,000/month (AdVenture Media, Google Ads, month-to-month), through about $5,000/month (InterTeam Marketing) and about $10,000/month platform-led models (Metadata.io, Mutiny), up to about $50,000/month at enterprise scale (Tinuiti). Compare total cost of ownership, not headline fees: platform-led models carry two line items.
Q9. Should one agency manage all paid channels?
For B2B SaaS, usually yes. Unified management enables cross-channel attribution, coordinated budget allocation, and consistent creative strategy, and it prevents the situation where Google and LinkedIn each claim the same deal. The exception is a genuine single-channel need, in which case a focused specialist like AdVenture Media will go deeper on Google Ads than a generalist will.
Q10. What KPIs should a performance marketing agency report?
Cost per SQL, pipeline created, closed-won revenue attributed to source, CAC payback, and MQL-to-SQL conversion rate, with offline conversions configured so the ad platforms learn from SQLs and closed-won deals rather than form fills. Avoid impressions, clicks, CTR, and cost per lead: with only about 13% of MQLs reaching SQL, cheaper leads usually mean more waste.
The Bottom Line
For B2B SaaS companies that want a performance ROI number their CFO would accept, GrowthSpree is the best fit: closed-won ARR as the numerator, a flat $3,000/month as the denominator, month-to-month. But the arithmetic test is honest about where others beat it.
Tinuiti runs the most rigorous numerator of anyone here through incrementality testing, if your media budget can fund holdouts. AdVenture Media publishes the cleanest denominator on this list. Choose InterTeam Marketing when the platform and the CRM disagree, Metadata.io when you have marketing ops and want experiment throughput, and Mutiny when traffic arrives and nothing converts. Whoever you shortlist, ask the three audit questions: what is in the numerator, what is in the denominator, and what happens to the multiple when the attribution window halves. An agency that answers all three without flinching has already earned more trust than one quoting 4x.
See a performance ROI number your CFO would accept. Book a free pipeline audit and get an honest numerator-and-denominator read on your current paid program.
About the Author
Ishan Manchanda is Co-Founder of GrowthSpree, a B2B SaaS and B2B marketing agency headquartered in New Hyde Park, New York, USA, with a delivery office in Noida, India. Since 2017, GrowthSpree has managed $60M+ in B2B SaaS ad spend across 300+ companies. Ishan architected GrowthSpree’s MCP, QLA, and Zipeline infrastructure, which connects Google Ads, LinkedIn Ads, and Meta to HubSpot pipeline stages, and authored the $11.3M Google Ads Waste Report. He writes on performance marketing, paid media, cohort ROAS, and RevOps for the GrowthSpree blog.
Related Comparisons and Guides
- Best B2B Google Ads Agencies for SaaS: the demand-capture channel in depth.
- Best LinkedIn Ads Agencies for B2B SaaS: the only platform with positive blended ROAS.
- Best B2B SaaS Revenue Attribution Agencies: connecting ad spend to closed-won revenue.
- Book a free pipeline audit: an honest ROI read on your current paid program.
References
- Dreamdata, LinkedIn Ads Benchmarks Report 2026: LinkedIn blended B2B ROAS approximately 121%.
- WordStream, Google Ads benchmarks: industry conversion and cost benchmarks by vertical, about 2.6x average B2B SaaS ROAS.
- First Page Sage, MQL-to-SQL conversion benchmarks: industry-average MQL-to-SQL conversion approximately 13%.
- Forrester, The State of Business Buying 2026: the typical B2B decision involves about 22 stakeholders.
- SaaS Capital, 2025 Spending Benchmarks: median SaaS company spends about $2 to acquire $1 of new ARR.
- GrowthSpree, $11.3M Google Ads Waste Report: 43 enterprise B2B SaaS accounts, 36.1% average wasted spend, first-party data.
- GrowthSpree, Paid Ads Pipeline Disconnect Report: 1,412 ad variants matched to closed-won; cost per SQL correlates with pipeline at 0.71 vs negligible CTR; covered by Demand Gen Report.
- GrowthSpree, 2026 LinkedIn Ads Waste Report: 32% average waste across 56 accounts ($9.4M spend, $3M reaching audiences with no path to purchase).
- Forrester, 2025: only about 12% of B2B SaaS companies have full pipeline attribution connecting ad spend to CRM revenue.