Pipeline,
not promises.
Senior operators audit your funnel in 48 hours. Ship 3 specific moves in 30 days.
- Full-funnel audit · 4 velocity levers
- 3 wins to ship in 30 days
- $3K flat · month-to-month
30-min call · No commitment
- Full-funnel audit · 4 velocity levers
- 3 wins to ship in 30 days
- $3K flat · month-to-month
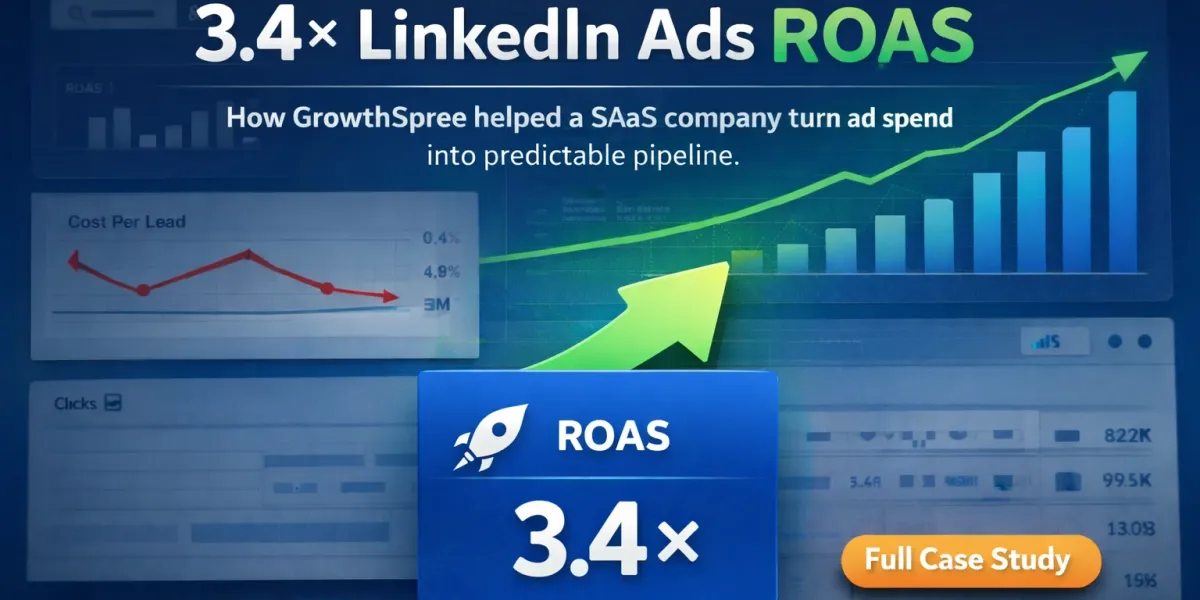
How a B2B SaaS Company Took LinkedIn Ads ROAS From 1.2x to 3.4x
Client: US-focused B2B SaaS, selling to mid-market businesses. Anonymised at the client’s request. Period: [TBC: insert before and after windows before publishing] Outcome in one sentence: Fixing targeting, frequency and attribution moved LinkedIn Ads from a 1.2x to a 3.4x return, and revealed the channel had been undercounted all along.
Results
| Metric | Before | After |
|---|---|---|
| Click-through rate | 0.39 percent | 0.82 percent |
| Cost per qualified lead | $410 | $238 |
| LinkedIn Ads ROAS | 1.2x | 3.4x |
| Unique companies reached | Baseline | Up 27 percent |
| Wasted impressions | Baseline | Down 19 percent |
Measurement period: [TBC]. See the method note at the end for what each figure does and does not cover.
The finding that changed the plan
Before any optimisation work, the account looked like a candidate for cancellation. LinkedIn showed a 1.2x return, and the client was close to moving the budget to Google.
Then we joined three data sets that had never been looked at together: LinkedIn Ads delivery, HubSpot CRM records, and website traffic.
The pattern was consistent. People at target accounts were seeing LinkedIn ads, not clicking, and arriving days or weeks later through direct or organic search. They then signed up in HubSpot, where the source was recorded as direct or organic. LinkedIn got no credit for any of it.
The channel was not underperforming. It was being undercounted. The journey looked like this:
LinkedIn ad impression → later website visit via direct or organic → HubSpot sign-up → sales pipeline
This matters more than any single percentage in the results table, because it changes what you do next. A channel that genuinely returns 1.2x should be cut. A channel that reports 1.2x because the measurement is broken should be fixed and funded. Those are opposite decisions, and the only thing separating them is whether anyone joined the data.
Worth saying plainly: view-through influence of this kind is the hardest thing in B2B measurement to prove. We treat it as directional evidence that justified continued investment, not as a precise attribution model.
What was wrong
Five problems, found in the audit before any changes were made.
1. Ad fatigue. The audience was narrow and the same people saw the same creative repeatedly. Click-through rate had fallen from 0.64 percent to 0.39 percent, a decline of about 39 percent.
2. Spend reaching the wrong companies. 28 percent of impressions were going to companies outside the ideal customer profile.
3. Budget concentrating in large accounts. A small number of companies with 1,000 or more employees were absorbing a disproportionate share of impressions, which crowded out the mid-market accounts the client actually sells to.
4. Job titles that engaged but did not buy. Targeting was built around Marketing Manager, Growth Specialist and Digital Marketing Associate. Those roles clicked. They did not own budget, so they rarely produced qualified opportunities.
5. Attribution missing entirely. The finding described above. LinkedIn’s contribution was landing in the direct and organic buckets.
What was changed
| Area | What we did |
|---|---|
| Analytics | Joined LinkedIn Ads, HubSpot CRM and website traffic data so the three could be read together |
| Scheduling | Concentrated delivery into high-engagement windows, Tuesday to Thursday mornings and weekday early afternoons, and cut weekend and late-night delivery |
| Frequency | Capped how often people at the same company saw the same ads |
| Targeting | Replaced the junior job titles with senior role groupings covering VP of Marketing, Head of Growth, Director of Marketing and CMO |
| Attribution | Analysed LinkedIn ad exposure at company level against HubSpot sign-ups, rather than relying on last-click |
| Creative | Tested messaging, ad formats and value propositions against the new senior audience |
The order mattered. The attribution work came first, because without it there was no way to tell which of the other four changes were working.
Why each fix worked
Fatigue was a scheduling and frequency problem, not a creative problem. The instinct with falling click-through rate is to make new ads. In a narrow B2B audience the more common cause is that the same people are seeing the same thing too often. Capping frequency and concentrating delivery into fewer, better hours raised click-through rate from 0.39 percent to 0.82 percent, which is above where it sat before fatigue set in.
Frequency capping redistributed the budget. Large enterprises have more employees matching any given filter, so an uncapped campaign spends disproportionately on them. Capping per company pushed budget outward into more accounts, which is why unique companies reached rose 27 percent without a budget increase.
Senior title grouping traded volume for qualification. Fewer clicks from people who can start a buying process beats more clicks from people who cannot. Cost per qualified lead fell from $410 to $238, a reduction of 42 percent.
What this costs you to copy
Three of the five fixes are free and can be done this week: frequency capping, schedule concentration, and replacing junior job titles with senior groupings. None require new tooling.
The attribution work is the one that takes effort, because it means joining ad platform data to CRM data rather than reading either in isolation. It is also the one that changed the decision. If you only do one thing from this case study, do that one.
How this was measured
The before and after figures come from the client’s LinkedIn Campaign Manager account and their HubSpot instance, compared across [TBC: insert periods]. Click-through rate, cost per qualified lead and unique companies reached are taken directly from Campaign Manager. Cost per qualified lead uses the client’s own qualification definition, applied consistently across both periods.
Two honest limitations.
The ROAS figures are reported as measured, 1.2x before and 3.4x after. We are not claiming a specific multiplier beyond that pair, because the gain depends on how revenue is attributed to a channel in a business with a long sales cycle.
The attribution finding is directional. Joining impression data to CRM sign-ups shows a strong and consistent pattern. It is not a controlled test, and no view-through model in B2B should be presented as one. We treated it as sufficient evidence to keep investing, not as proof of a precise contribution figure.
Other results on the same work will differ. The starting point here included an account with identifiable targeting and measurement problems, which is where the largest gains usually sit.
Frequently Asked Questions
Q1. Why do B2B SaaS companies struggle to make LinkedIn Ads pay?
Usually three things at once: narrow audiences that fatigue quickly, budget concentrating in the largest companies in the target list, and attribution that credits LinkedIn only for last-click conversions. The third one is the most damaging, because it makes a working channel look like a failing one.
Q2. Why did LinkedIn look like it was underperforming here?
Because people were seeing ads, not clicking, and returning later through direct or organic search. The sign-up was recorded against that later visit. LinkedIn received no credit for the exposure that started the journey.
Q3. How do you fix LinkedIn attribution for B2B?
Stop reading the ad platform in isolation. Join LinkedIn delivery data to CRM records at company level and look at whether target accounts that saw ads later converted through other channels. It will not give you a precise percentage, but it will tell you whether the channel is contributing at all, which is the decision that actually matters.
Q4. What causes LinkedIn ad fatigue, and how do you fix it?
A narrow audience seeing the same creative too often. New creative helps, but the faster fix is frequency capping and concentrating delivery into fewer, higher-engagement hours. In this account that moved click-through rate from 0.39 percent to 0.82 percent.
Q5. Why does budget concentrate in large companies on LinkedIn?
Large organisations have more employees matching any given job title or seniority filter, so an uncapped campaign naturally serves them more impressions. If you sell to mid-market, this quietly spends your budget on companies you are not trying to reach. Capping frequency per company redistributes it.
Q6. Should I target job titles or seniority on LinkedIn?
For most B2B SaaS, senior groupings beat specific junior titles. Junior marketing roles engage well and rarely own budget, which produces good click-through rates and poor pipeline. Grouping senior roles such as VP, Head of, Director and C-level trades click volume for qualification.
Q7. How much of this can I do without an agency?
Most of it. Frequency capping, schedule concentration and senior title targeting are settings changes you can make today at no cost. The attribution work is the part that needs someone to join ad data to CRM data and keep it current.
Q8. What results should I expect?
Different ones. The figures here come from one account that began with clear targeting and measurement problems, which is where the biggest improvements usually come from. A well-run account will see smaller gains from the same changes.
Q9. How long does this take to show up?
Settings changes such as frequency capping and scheduling affect delivery within days. Targeting changes need a few weeks before the lead quality difference is readable. Anything revenue related takes a full sales cycle, which in B2B SaaS is usually months rather than weeks.
Q10. Is LinkedIn worth it compared with Google for B2B SaaS?
They do different jobs. Google captures people already searching. LinkedIn reaches buying committees who are not searching yet, which is why its contribution so often lands in direct and organic once those people do search. Judging LinkedIn on last-click against Google is the comparison that leads most teams to cut it.
Want the same audit on your account?
We run LinkedIn Ads for B2B SaaS companies, starting with the measurement rather than the campaigns. If your LinkedIn reporting looks weak and you suspect it is being undercounted, that is the first thing we check.
Related reading
- LinkedIn Ads audience size and budget for B2B SaaS
- Send HubSpot offline conversions to every ad platform
- Why your B2B SaaS Google Ads look profitable but don’t create pipeline
- Google Ads with a 3 to 9 month B2B sales cycle
- LinkedIn Ads agency for B2B SaaS
- The LinkedIn Ads Waste Report 2026
About the author
Ishan Manchanda is Co-Founder at GrowthSpree, a B2B SaaS marketing agency and Google Partner and HubSpot Solutions Partner rated 4.9 on G2. GrowthSpree manages $60M+ in B2B SaaS ad spend across 300+ accounts.