Marketing Attribution Reporting: Dashboards That Actually Get Used
Quick answer: Useful marketing attribution reporting answers one question for its audience and reports the metric that maps to revenue — pipeline and revenue influenced, not leads and clicks. Most dashboards fail because they show everything (so nobody reads them), report vanity metrics (so nobody acts), or present a single attribution model as truth (so nobody trusts them). Build one focused view per audience, lead with pipeline, show directional attribution honestly, and match cadence to decisions.
Key takeaways
- One dashboard, one audience, one question. “Everything” dashboards get ignored.
- Report pipeline and revenue, not leads and clicks — connect marketing to money.
- Attribution is directional, not gospel. Present it as a view, not a verdict.
- Cadence matches decisions: weekly ops view, monthly strategy view, quarterly board view.
- Trust comes from consistency — same definitions, same source, every time.
Most marketing dashboards are built once, admired briefly, and never opened again. The problem isn’t the tool — it’s that they report what’s easy to measure instead of what drives decisions. This guide covers how to build attribution reporting people actually use: the metrics that matter, the traps that kill trust, and how to structure reporting by audience.
What is marketing attribution reporting?
Marketing attribution reporting is how you show which marketing activities contributed to pipeline and revenue, so the team can decide where to invest. It sits on top of your attribution model (how credit is assigned across touchpoints) and translates it into decisions. The report is not the model — it’s the interface between the data and the humans who allocate budget. A great model behind an unusable report changes nothing.
Why do most marketing dashboards fail?
Three failure modes:
- They show everything. Forty metrics on one screen means no signal and no action. Nobody knows what to look at, so nobody looks.
- They report vanity metrics. Impressions, clicks, and MQL counts feel like progress but don’t map to revenue, so leadership can’t act on them.
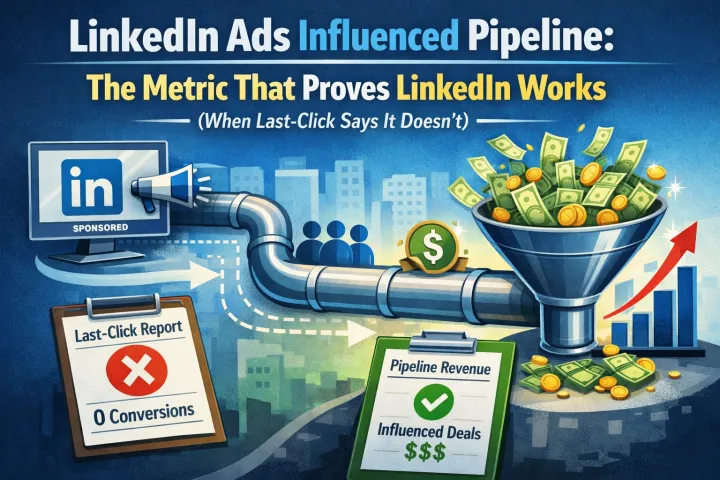
- They present one model as truth. Showing last-click (or any single model) as the answer invites the “that’s not how attribution works” argument, and trust collapses.
The fix for all three: fewer metrics, revenue-linked, presented as a directional view.
What metrics belong in attribution reporting?
Report the metrics that connect marketing to money, roughly in this hierarchy:
| Tier | Metric | Why it belongs |
|---|---|---|
| Revenue | Revenue influenced / sourced by channel | The number leadership cares about |
| Pipeline | Pipeline created by channel | Leading indicator of revenue |
| Efficiency | Blended CAC / cost per opportunity | Is growth affordable? |
| Quality | MQL-to-SQL rate by source | Are the leads real? |
| Volume | Qualified leads by source | Context, not headline |
Notice clicks and impressions aren’t in the top tiers — they’re diagnostics you drill into, not headlines you report. Lead with pipeline and revenue; keep volume metrics available but subordinate.
Field note: The fastest way to make a marketing dashboard credible with a CFO or CEO is to stop reporting leads as the headline and start reporting pipeline. Leads are a marketing-internal metric; pipeline is a shared business metric. The moment your report leads with “pipeline created by channel” instead of “MQLs by channel,” the conversation shifts from “is marketing busy?” to “is marketing working?” — and that’s the conversation you want.
How do you present attribution without starting a fight?
Attribution arguments happen when one model is presented as truth. Defuse it by being explicit that attribution is directional:
- State the model you’re using and its known bias (e.g., “last-touch, which over-credits capture channels”).
- Show more than one view where it matters — first-touch and last-touch side by side reveal demand creation vs. capture.
- Pair models with self-reported attribution (“how did you hear about us?”) as a reality check.
- Frame it as a decision aid, not a scoreboard: “these channels appear to create demand; these capture it.”
This honesty is what earns trust — see multi-touch attribution for B2B SaaS for why no single model is complete.
How should you structure reporting by audience?
One dashboard can’t serve everyone. Build a view per audience, each answering that audience’s question:
- Weekly ops view (marketing team): spend, pacing, CPL, and anomalies — operational, action-oriented.
- Monthly strategy view (marketing leadership): pipeline by channel, blended CAC, quality trends — allocation decisions.
- Quarterly board view (executives): revenue influenced, efficiency, and growth trajectory — outcomes, not activity.
Each view is focused, answers one question, and uses the same underlying definitions so the numbers reconcile across them.
How do you make reporting effortless and trustworthy?
Trust comes from consistency: the same metrics, defined the same way, from the same source, every time. The operational challenge is that the data lives across ad platforms, analytics, and the CRM, so reports are slow to build and easy to build differently each time. Connecting those sources to one assistant makes the recurring report a repeatable query rather than a manual rebuild — “pipeline created and blended CAC by channel this month vs last” pulled straight from the complete MCP stack, with CRM outcomes via HubSpot or Salesforce and behavior via GA4. Automating the assembly keeps the definitions consistent, which is what makes people trust the report.
Frequently Asked Questions
Q1. What is marketing attribution reporting?
It’s how you show which marketing activities contributed to pipeline and revenue so the team can decide where to invest. It translates your attribution model into decision-ready views, connecting marketing activity to business outcomes.
Q2. Why do marketing dashboards go unused?
Because they show too many metrics (no signal), report vanity metrics like clicks and MQL counts (no link to revenue), or present a single attribution model as truth (no trust). The fix is fewer, revenue-linked metrics presented as a directional view.
Q3. What metrics should a marketing dashboard show?
Lead with revenue influenced and pipeline created by channel, then blended CAC and cost per opportunity, then MQL-to-SQL rate, with lead volume as context. Clicks and impressions are diagnostics to drill into, not headline metrics.
Q4. How do you report attribution without arguments?
Present it as directional: state your model and its bias, show more than one view (first-touch vs last-touch), pair it with self-reported attribution, and frame it as a decision aid rather than a scoreboard. Arguments come from treating one model as absolute truth.
Q5. How often should you report marketing attribution?
Match cadence to decisions: a weekly operational view for the marketing team, a monthly strategy view for leadership, and a quarterly outcomes view for the board — each answering that audience’s question with consistent definitions.
Sources & further reading
- Google Analytics and CRM documentation — channel grouping, attribution models, and pipeline reporting.
- Reconcile all reporting to a single source of truth (usually the CRM) to keep definitions consistent.
Related guides: Multi-Touch Attribution for B2B SaaS · The Complete MCP Stack for B2B SaaS Marketing Teams · HubSpot CRM MCP · GA4 MCP Server.